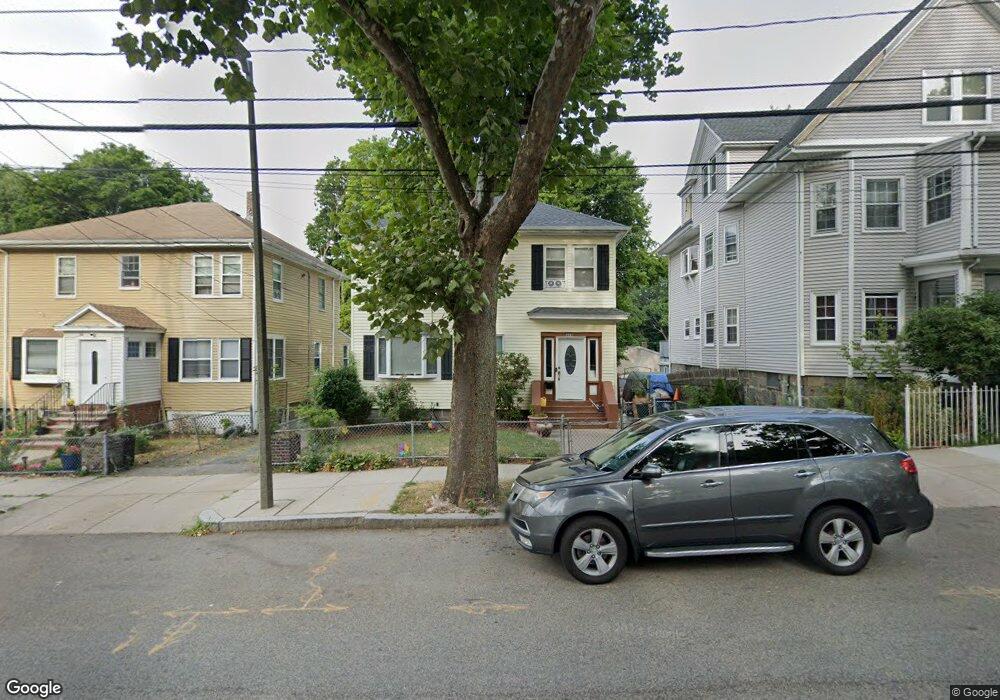
220 Almont St Unit B Mattapan, MA 02126
Southern Mattapan NeighborhoodEstimated Value: $2,432,000 - $2,654,000
4
Beds
6
Baths
4,904
Sq Ft
$517/Sq Ft
Est. Value
About This Home
This home is located at 220 Almont St Unit B, Mattapan, MA 02126 and is currently estimated at $2,535,389, approximately $517 per square foot. 220 Almont St Unit B is a home located in Suffolk County with nearby schools including KIPP Academy Boston Charter School and Berea Seventh-day Adventist Academy.
Ownership History
Date
Name
Owned For
Owner Type
Purchase Details
Closed on
Sep 30, 2015
Sold by
Wexler Susan D and Wexler Andrew M
Bought by
220B Allandale Road Rt
Current Estimated Value
Home Financials for this Owner
Home Financials are based on the most recent Mortgage that was taken out on this home.
Original Mortgage
$1,102,500
Outstanding Balance
$869,492
Interest Rate
3.95%
Estimated Equity
$1,665,897
Purchase Details
Closed on
Oct 22, 2012
Sold by
Wexler Robert H
Bought by
Joanna B Wexler Irt
Purchase Details
Closed on
Jul 6, 2006
Sold by
Wexler Robert H
Bought by
Joanna B Wexler Irt
Purchase Details
Closed on
Mar 22, 2006
Sold by
Wexler Joanna B
Bought by
Wexler Robert H
Purchase Details
Closed on
Nov 22, 2004
Sold by
Wexler Joanna B and Wexler Robert H
Bought by
Wexler Joanna B
Purchase Details
Closed on
Aug 15, 2003
Sold by
Pitcher Beatrice L
Bought by
Wexler Robert H and Wexler Joanna B
Create a Home Valuation Report for This Property
The Home Valuation Report is an in-depth analysis detailing your home's value as well as a comparison with similar homes in the area
Home Values in the Area
Average Home Value in this Area
Purchase History
| Date | Buyer | Sale Price | Title Company |
|---|---|---|---|
| 220B Allandale Road Rt | $1,590,000 | -- | |
| Joanna B Wexler Irt | -- | -- | |
| Wexler Susan D | -- | -- | |
| Joanna B Wexler Irt | -- | -- | |
| Joanna B Wexler Irt | -- | -- | |
| Wexler Robert H | -- | -- | |
| Wexler Joanna B | -- | -- | |
| Wexler Robert H | $1,250,000 | -- |
Source: Public Records
Mortgage History
| Date | Status | Borrower | Loan Amount |
|---|---|---|---|
| Open | 220B Allandale Road Rt | $1,102,500 |
Source: Public Records
Tax History Compared to Growth
Tax History
| Year | Tax Paid | Tax Assessment Tax Assessment Total Assessment is a certain percentage of the fair market value that is determined by local assessors to be the total taxable value of land and additions on the property. | Land | Improvement |
|---|---|---|---|---|
| 2025 | $28,781 | $2,485,400 | $0 | $2,485,400 |
| 2024 | $24,234 | $2,223,300 | $0 | $2,223,300 |
| 2023 | $22,723 | $2,115,700 | $0 | $2,115,700 |
| 2022 | $21,720 | $1,996,300 | $0 | $1,996,300 |
| 2021 | $20,883 | $1,957,200 | $0 | $1,957,200 |
| 2020 | $18,206 | $1,724,100 | $0 | $1,724,100 |
| 2019 | $16,825 | $1,596,300 | $0 | $1,596,300 |
| 2018 | $16,402 | $1,565,100 | $0 | $1,565,100 |
| 2017 | $15,942 | $1,505,400 | $0 | $1,505,400 |
| 2016 | $15,622 | $1,420,200 | $0 | $1,420,200 |
| 2015 | $18,597 | $1,535,710 | $0 | $1,535,710 |
| 2014 | $13,415 | $1,066,340 | $0 | $1,066,340 |
Source: Public Records
Map
Nearby Homes
- 10 Itasca St
- 4 Gilmer St
- 49 Fottler Rd
- 58 Mattapan St
- 45 1st Ave Unit 111
- 14-14R Kennebec St
- 116 Almont St
- 710 Walk Hill St
- 60 and 64 Monterey Ave
- 30-32 Westmore Rd
- 20 Monterey Ave
- 100 Itasca St
- 23 Fessenden St
- 25 Fessenden St
- 12 Hiawatha Rd
- 10 Hosmer St
- 6 Deering Rd
- 567B Norfolk St
- 17 Greendale Rd Unit 2F
- 84 W Main St Unit 84
- 220 Almont St Unit C
- 220 Almont St Unit A
- 220 Almont St
- 216 Almont St
- 224 Almont St Unit B
- 224 Almont St
- 212 Almont St
- 228 Almont St Unit 1D
- 228 Almont St
- 31 Wabash St
- 208 Almont St
- 27 Wabash St
- 35 Wabash St
- 230 Almont St
- 211 Almont St
- 23 Prairie St
- 23 Wabash St
- 137 Mattapan St
- 204 Almont St
- 137 Mattapan St