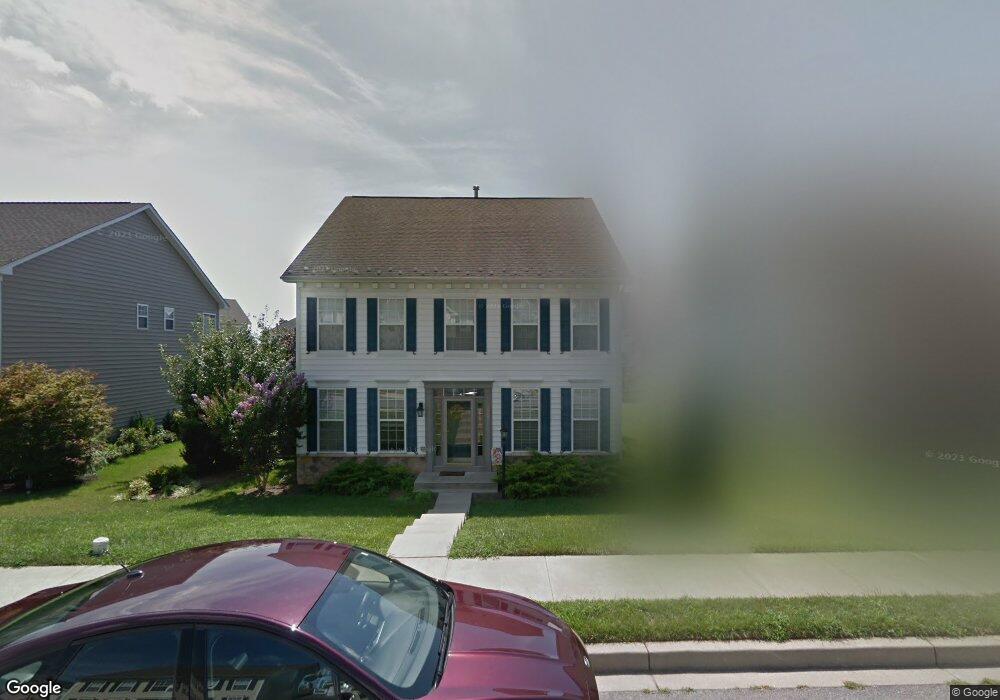
220 Marley St Unit 45 New Market, MD 21774
Estimated Value: $658,435 - $737,000
4
Beds
3
Baths
2,662
Sq Ft
$259/Sq Ft
Est. Value
About This Home
This home is located at 220 Marley St Unit 45, New Market, MD 21774 and is currently estimated at $690,609, approximately $259 per square foot. 220 Marley St Unit 45 is a home located in Frederick County with nearby schools including New Market Elementary School, New Market Middle School, and Linganore High School.
Ownership History
Date
Name
Owned For
Owner Type
Purchase Details
Closed on
May 27, 2021
Sold by
Eldridge Colby James and Eldridge Janice Lynn
Bought by
Eldridge Colby James and The Colby James Eldridge Livin
Current Estimated Value
Purchase Details
Closed on
Apr 3, 2019
Sold by
Anderson Katherine Anne
Bought by
Eldridge Colby J and Eldridge Janice L
Home Financials for this Owner
Home Financials are based on the most recent Mortgage that was taken out on this home.
Original Mortgage
$398,000
Outstanding Balance
$350,617
Interest Rate
4.4%
Mortgage Type
New Conventional
Estimated Equity
$339,992
Purchase Details
Closed on
Jan 24, 2013
Sold by
Bishop John and Bishop Darlene
Bought by
Anderson Katherine Anne
Home Financials for this Owner
Home Financials are based on the most recent Mortgage that was taken out on this home.
Original Mortgage
$336,734
Interest Rate
3.38%
Mortgage Type
New Conventional
Purchase Details
Closed on
Jun 2, 2009
Sold by
Dr Horton Inc
Bought by
Bishop John C and Bishop Darlene D
Create a Home Valuation Report for This Property
The Home Valuation Report is an in-depth analysis detailing your home's value as well as a comparison with similar homes in the area
Home Values in the Area
Average Home Value in this Area
Purchase History
| Date | Buyer | Sale Price | Title Company |
|---|---|---|---|
| Eldridge Colby James | -- | None Available | |
| Eldridge Colby J | $455,000 | Lakeside Title Company | |
| Anderson Katherine Anne | $330,000 | Quantum Title Corporation | |
| Bishop John C | $355,000 | -- |
Source: Public Records
Mortgage History
| Date | Status | Borrower | Loan Amount |
|---|---|---|---|
| Open | Eldridge Colby J | $398,000 | |
| Previous Owner | Anderson Katherine Anne | $336,734 | |
| Closed | Bishop John C | -- |
Source: Public Records
Tax History Compared to Growth
Tax History
| Year | Tax Paid | Tax Assessment Tax Assessment Total Assessment is a certain percentage of the fair market value that is determined by local assessors to be the total taxable value of land and additions on the property. | Land | Improvement |
|---|---|---|---|---|
| 2025 | $6,153 | $519,467 | -- | -- |
| 2024 | $6,153 | $485,300 | $125,100 | $360,200 |
| 2023 | $5,641 | $453,967 | $0 | $0 |
| 2022 | $5,410 | $422,633 | $0 | $0 |
| 2021 | $5,051 | $391,300 | $105,000 | $286,300 |
| 2020 | $4,999 | $384,067 | $0 | $0 |
| 2019 | $4,917 | $376,833 | $0 | $0 |
| 2018 | $4,863 | $369,600 | $105,000 | $264,600 |
| 2017 | $4,655 | $369,600 | $0 | $0 |
| 2016 | $4,363 | $343,267 | $0 | $0 |
| 2015 | $4,363 | $330,100 | $0 | $0 |
| 2014 | $4,363 | $330,100 | $0 | $0 |
Source: Public Records
Map
Nearby Homes
- 308 E Wainscot Dr
- 25 W Main St
- 11128 Worchester Dr
- 5633 Tessie Ct
- 5518 Roy Ct
- 5613 Bobolink Trail
- 4936D Green Valley Rd
- 4920 Ed Mcclain Rd
- 10816 Dewey Way E
- 5810 Whiterose Way
- 10611 Victorian Ave
- 5909 Constance Way
- 5948 Jacobean Place
- 5816 Drexal Ave
- 10576 Edwardian Ln
- 4799 Mid Lynn Ct
- 11397 Weller Rd
- 6115 Huckleberry Way
- 6184 Sawyer Rd
- 6237 N Steamboat Way