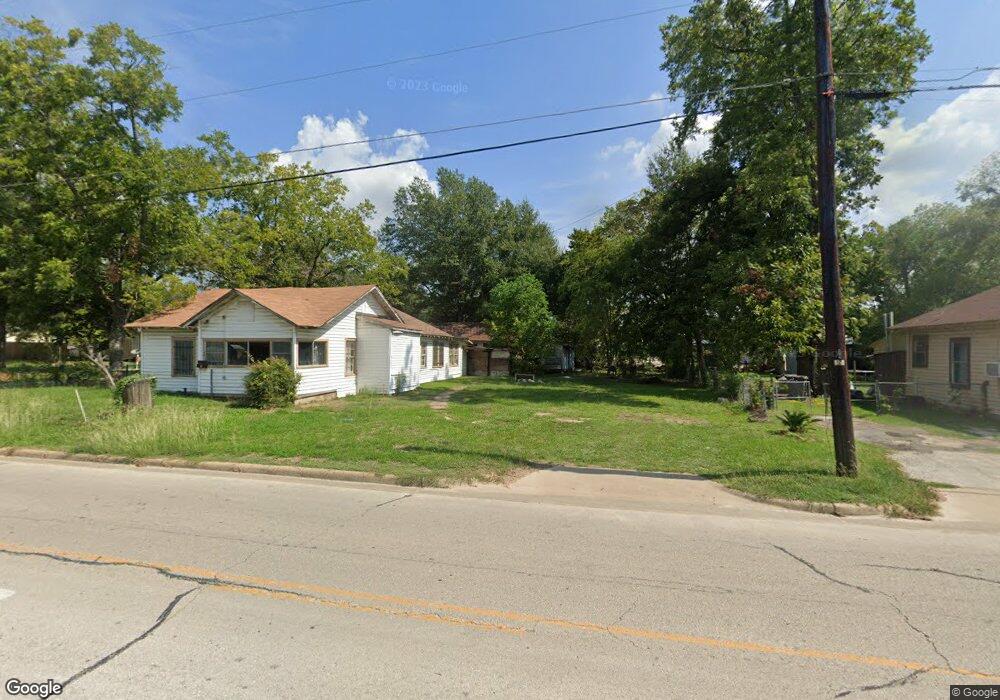
220 Martin Luther King jr Blvd Unit 222 Lufkin, TX 75904
Estimated Value: $59,000 - $187,000
--
Bed
--
Bath
1,514
Sq Ft
$84/Sq Ft
Est. Value
About This Home
This home is located at 220 Martin Luther King jr Blvd Unit 222, Lufkin, TX 75904 and is currently estimated at $127,319, approximately $84 per square foot. 220 Martin Luther King jr Blvd Unit 222 is a home located in Angelina County with nearby schools including Garrett Primary School, Dunbar Primary School, and Brandon Elementary School.
Create a Home Valuation Report for This Property
The Home Valuation Report is an in-depth analysis detailing your home's value as well as a comparison with similar homes in the area
Home Values in the Area
Average Home Value in this Area
Tax History Compared to Growth
Tax History
| Year | Tax Paid | Tax Assessment Tax Assessment Total Assessment is a certain percentage of the fair market value that is determined by local assessors to be the total taxable value of land and additions on the property. | Land | Improvement |
|---|---|---|---|---|
| 2025 | $2,348 | $112,340 | $13,760 | $98,580 |
| 2024 | $2,291 | $109,620 | $13,760 | $95,860 |
| 2023 | $2,142 | $107,800 | $13,760 | $94,040 |
| 2022 | $1,500 | $65,870 | $4,750 | $61,120 |
| 2021 | $1,498 | $60,810 | $4,750 | $56,060 |
| 2020 | $1,326 | $53,950 | $3,720 | $50,230 |
| 2019 | $1,402 | $53,950 | $3,720 | $50,230 |
| 2018 | $1,187 | $52,050 | $3,720 | $48,330 |
| 2017 | $1,187 | $49,800 | $3,720 | $46,080 |
| 2016 | $1,166 | $48,920 | $3,720 | $45,200 |
| 2015 | -- | $48,210 | $3,720 | $44,490 |
| 2014 | -- | $55,030 | $3,720 | $51,310 |
Source: Public Records
Map
Nearby Homes
- 408 Bob St
- 1101 N 1st St
- 417 Martin Luther King jr Blvd
- 318 Lake Alley
- 515 Martin Luther King jr Blvd
- TBD State Highway 103
- 223 Stoney Ridge
- 902 Cain St
- 1123 Sayers St
- 233 N Banks St
- 4795 LEWIS & PO Norwood Dr
- 1706 approx. Norwood Dr
- 333 Humason Ave
- 801 Rowe Ave
- 801 Oquinn Ave
- 1518 Phelps St
- 521 N 1st St
- Lt 5.2 & 6 Treadwell Ave
- 116 Pine St
- 112 Pine St
- 212 Martin Luther King jr Blvd
- 130 Martin Luther King jr Blvd
- 218 Martin Luther King jr Blvd
- 213 Martin Luther King Dr
- 213 Martin Luther King jr Blvd
- 217 Martin Luther King Dr
- 124 Martin Luther King jr Blvd
- 217 Martin Luther King jr Blvd
- 131 Martin Luther King jr Blvd
- 219 Martin Luther King jr Blvd
- 122 Martin Luther King jr Blvd
- 125 Martin Luther King jr Blvd
- 503 Birch St
- 123 Martin Luther King jr Blvd
- 118 Martin Luther King jr Blvd
- 310 Joplin St
- 308 Joplin St
- 312 Joplin St
- 326 Martin Luther King jr Blvd
- 306 Joplin St