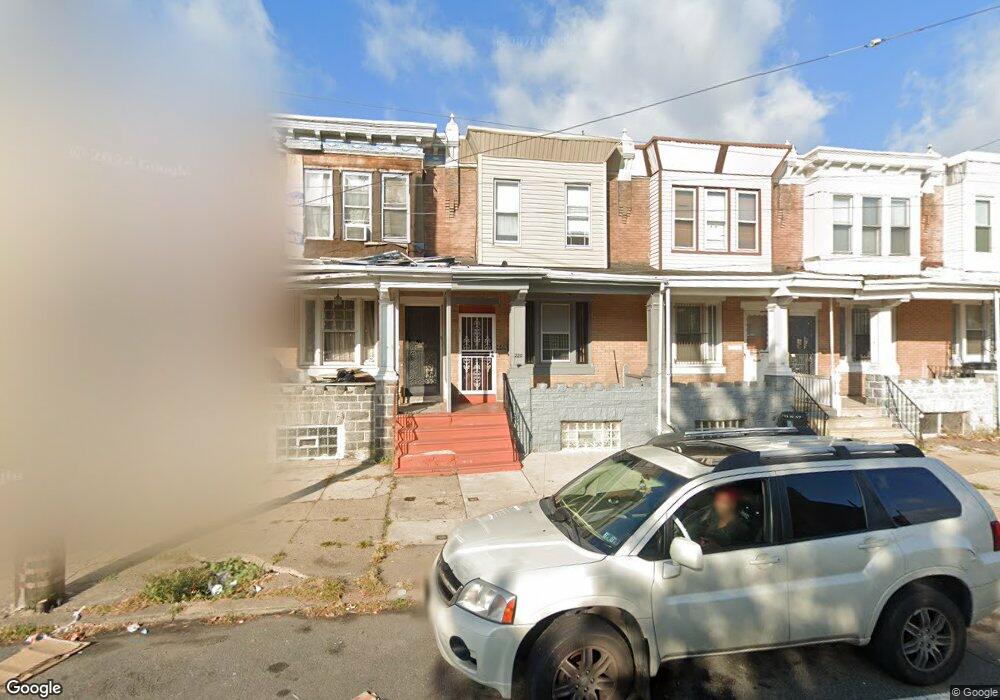
220 N 57th St Philadelphia, PA 19139
Haddington NeighborhoodEstimated Value: $121,000 - $191,000
3
Beds
1
Bath
1,160
Sq Ft
$130/Sq Ft
Est. Value
About This Home
This home is located at 220 N 57th St, Philadelphia, PA 19139 and is currently estimated at $151,155, approximately $130 per square foot. 220 N 57th St is a home located in Philadelphia County with nearby schools including John Barry Elementary School, William L. Sayre High School, and Universal Bluford Charter School.
Ownership History
Date
Name
Owned For
Owner Type
Purchase Details
Closed on
Jun 17, 2009
Sold by
Mcdaniel Janet
Bought by
Mccloud Sonny
Current Estimated Value
Home Financials for this Owner
Home Financials are based on the most recent Mortgage that was taken out on this home.
Original Mortgage
$92,198
Outstanding Balance
$60,750
Interest Rate
5.58%
Mortgage Type
FHA
Estimated Equity
$90,405
Purchase Details
Closed on
Jul 2, 2008
Sold by
Moore Joseph S
Bought by
Mcdaniel Janet
Purchase Details
Closed on
Apr 20, 2007
Sold by
Morgan Sara Elaine and Estate Of Samuel Morgan
Bought by
Moore Joseph S
Create a Home Valuation Report for This Property
The Home Valuation Report is an in-depth analysis detailing your home's value as well as a comparison with similar homes in the area
Home Values in the Area
Average Home Value in this Area
Purchase History
| Date | Buyer | Sale Price | Title Company |
|---|---|---|---|
| Mccloud Sonny | $93,900 | None Available | |
| Mcdaniel Janet | $10,000 | None Available | |
| Moore Joseph S | -- | None Available |
Source: Public Records
Mortgage History
| Date | Status | Borrower | Loan Amount |
|---|---|---|---|
| Open | Mccloud Sonny | $92,198 |
Source: Public Records
Tax History Compared to Growth
Tax History
| Year | Tax Paid | Tax Assessment Tax Assessment Total Assessment is a certain percentage of the fair market value that is determined by local assessors to be the total taxable value of land and additions on the property. | Land | Improvement |
|---|---|---|---|---|
| 2025 | $1,706 | $150,000 | $30,000 | $120,000 |
| 2024 | $1,706 | $150,000 | $30,000 | $120,000 |
| 2023 | $1,706 | $121,900 | $24,380 | $97,520 |
| 2022 | $1,198 | $121,900 | $24,380 | $97,520 |
| 2021 | $1,198 | $0 | $0 | $0 |
| 2020 | $1,198 | $0 | $0 | $0 |
| 2019 | $1,153 | $0 | $0 | $0 |
| 2018 | $1,121 | $0 | $0 | $0 |
| 2017 | $1,121 | $0 | $0 | $0 |
| 2016 | $1,121 | $0 | $0 | $0 |
| 2015 | $466 | $0 | $0 | $0 |
| 2014 | -- | $34,800 | $4,718 | $30,082 |
| 2012 | -- | $4,960 | $1,395 | $3,565 |
Source: Public Records
Map
Nearby Homes