Estimated Value: $267,326 - $293,000
3
Beds
2
Baths
1,239
Sq Ft
$223/Sq Ft
Est. Value
About This Home
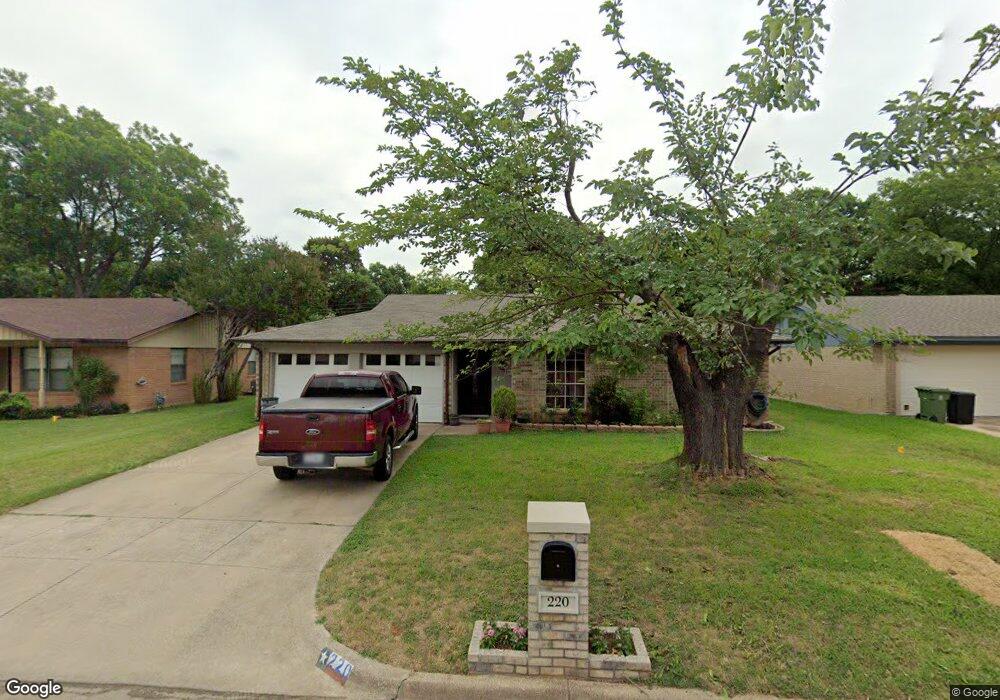
This home is located at 220 Simmons Dr, Hurst, TX 76053 and is currently estimated at $276,332, approximately $223 per square foot. 220 Simmons Dr is a home located in Tarrant County with nearby schools including West Hurst Elementary School, Hurst J High School, and L.D. Bell High School.
Ownership History
Date
Name
Owned For
Owner Type
Purchase Details
Closed on
Mar 29, 2013
Sold by
Sozo Properties Llc
Bought by
Macedo Alejandro and Macedo Veronica
Current Estimated Value
Home Financials for this Owner
Home Financials are based on the most recent Mortgage that was taken out on this home.
Original Mortgage
$84,600
Outstanding Balance
$59,959
Interest Rate
3.56%
Mortgage Type
Purchase Money Mortgage
Estimated Equity
$216,373
Purchase Details
Closed on
Mar 21, 2013
Sold by
Hoover Gary W and Roberts Sandra K
Bought by
Sozo Properties Llc
Home Financials for this Owner
Home Financials are based on the most recent Mortgage that was taken out on this home.
Original Mortgage
$84,600
Outstanding Balance
$59,959
Interest Rate
3.56%
Mortgage Type
Purchase Money Mortgage
Estimated Equity
$216,373
Create a Home Valuation Report for This Property
The Home Valuation Report is an in-depth analysis detailing your home's value as well as a comparison with similar homes in the area
Home Values in the Area
Average Home Value in this Area
Purchase History
| Date | Buyer | Sale Price | Title Company |
|---|---|---|---|
| Macedo Alejandro | -- | None Available | |
| Sozo Properties Llc | -- | First Western Title Co |
Source: Public Records
Mortgage History
| Date | Status | Borrower | Loan Amount |
|---|---|---|---|
| Open | Macedo Alejandro | $84,600 |
Source: Public Records
Tax History Compared to Growth
Tax History
| Year | Tax Paid | Tax Assessment Tax Assessment Total Assessment is a certain percentage of the fair market value that is determined by local assessors to be the total taxable value of land and additions on the property. | Land | Improvement |
|---|---|---|---|---|
| 2025 | $3,972 | $194,455 | $60,000 | $134,455 |
| 2024 | $3,972 | $194,455 | $60,000 | $134,455 |
| 2023 | $3,749 | $187,151 | $30,000 | $157,151 |
| 2022 | $3,660 | $158,965 | $30,000 | $128,965 |
| 2021 | $3,493 | $144,824 | $30,000 | $114,824 |
| 2020 | $3,738 | $155,366 | $30,000 | $125,366 |
| 2019 | $3,937 | $160,838 | $30,000 | $130,838 |
| 2018 | $3,612 | $147,588 | $18,000 | $129,588 |
| 2017 | $3,550 | $140,271 | $18,000 | $122,271 |
| 2016 | $3,119 | $123,264 | $18,000 | $105,264 |
| 2015 | $2,971 | $113,300 | $12,000 | $101,300 |
| 2014 | $2,971 | $113,300 | $12,000 | $101,300 |
Source: Public Records
Map
Nearby Homes
- 637 Post Oak Dr
- 408 Simmons Dr
- 425 Ridgecrest Dr
- 520 W Redbud Dr
- 741 Ponderosa Dr
- 808 Betty Ct
- 125 Souder Dr
- 744 Briarwood Ln
- 756 Briarwood Ln
- 758 Briarwood Ln
- 425 Moore Creek Rd
- 516 Hurstview Dr
- 628 Elm St
- 612 Elm St
- 708 Hurstview Dr
- 120 Charlene Dr
- 3216 Fountain Pkwy
- 205 Corinna Ct
- 405 Billy Creek Cir
- 231 Elm St
- 224 Simmons Dr
- 216 Simmons Dr
- 228 Simmons Dr
- 212 Simmons Dr
- 104 Post Oak Cir
- 629 Post Oak Dr
- 625 Post Oak Dr
- 232 Simmons Dr
- 208 Simmons Dr
- 633 Post Oak Dr
- 221 Simmons Dr
- 217 Simmons Dr
- 225 Simmons Dr
- 229 Simmons Dr
- 108 Post Oak Cir
- 213 Simmons Dr
- 236 Simmons Dr
- 233 Simmons Dr
- 204 Simmons Dr
- 209 Simmons Dr