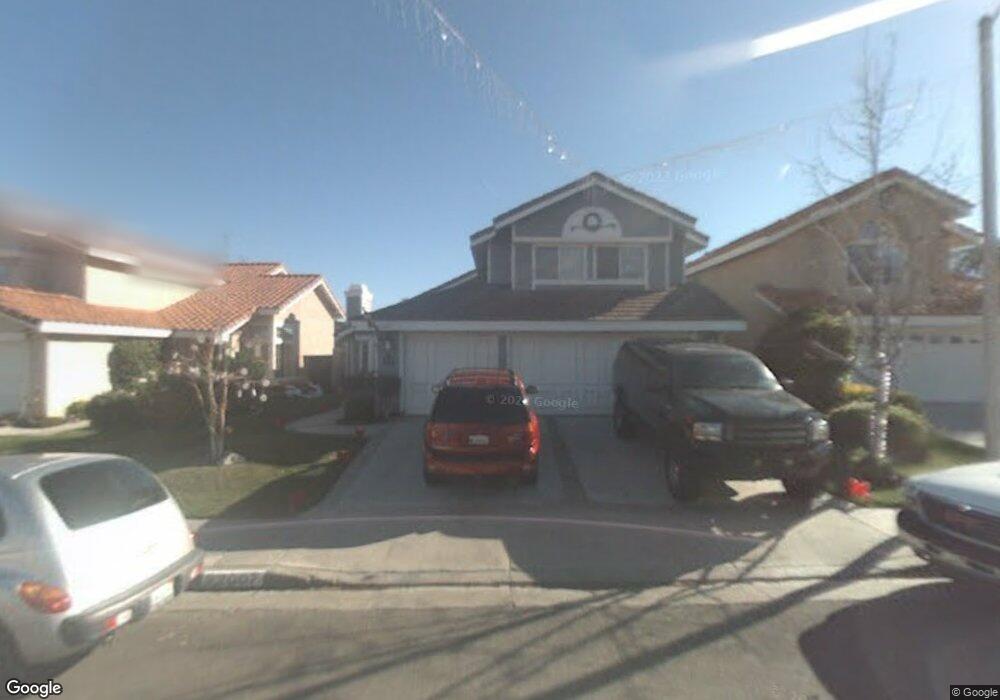
22007 Pamplico Dr Santa Clarita, CA 91350
Saugus NeighborhoodEstimated Value: $861,000 - $930,000
4
Beds
3
Baths
2,212
Sq Ft
$404/Sq Ft
Est. Value
About This Home
This home is located at 22007 Pamplico Dr, Santa Clarita, CA 91350 and is currently estimated at $893,219, approximately $403 per square foot. 22007 Pamplico Dr is a home located in Los Angeles County with nearby schools including Highlands Elementary School, Arroyo Seco Junior High School, and Saugus High School.
Ownership History
Date
Name
Owned For
Owner Type
Purchase Details
Closed on
Nov 9, 2011
Sold by
Bennett John
Bought by
Betancourt Martin
Current Estimated Value
Home Financials for this Owner
Home Financials are based on the most recent Mortgage that was taken out on this home.
Original Mortgage
$297,000
Outstanding Balance
$201,839
Interest Rate
3.95%
Mortgage Type
New Conventional
Estimated Equity
$691,380
Purchase Details
Closed on
Oct 19, 2011
Sold by
Ferrero Vanessa
Bought by
Betancourt Martin
Home Financials for this Owner
Home Financials are based on the most recent Mortgage that was taken out on this home.
Original Mortgage
$297,000
Outstanding Balance
$201,839
Interest Rate
3.95%
Mortgage Type
New Conventional
Estimated Equity
$691,380
Purchase Details
Closed on
May 13, 1998
Sold by
Chamberlain Mark B
Bought by
Bennett John and Bennett Rachel
Home Financials for this Owner
Home Financials are based on the most recent Mortgage that was taken out on this home.
Original Mortgage
$209,600
Interest Rate
7%
Create a Home Valuation Report for This Property
The Home Valuation Report is an in-depth analysis detailing your home's value as well as a comparison with similar homes in the area
Home Values in the Area
Average Home Value in this Area
Purchase History
| Date | Buyer | Sale Price | Title Company |
|---|---|---|---|
| Betancourt Martin | $397,000 | Lawyers Title Company | |
| Betancourt Martin | -- | Lawyers Title Company | |
| Bennett John | $262,000 | Southland Title Corporation |
Source: Public Records
Mortgage History
| Date | Status | Borrower | Loan Amount |
|---|---|---|---|
| Open | Betancourt Martin | $297,000 | |
| Previous Owner | Bennett John | $209,600 |
Source: Public Records
Tax History Compared to Growth
Tax History
| Year | Tax Paid | Tax Assessment Tax Assessment Total Assessment is a certain percentage of the fair market value that is determined by local assessors to be the total taxable value of land and additions on the property. | Land | Improvement |
|---|---|---|---|---|
| 2025 | $6,705 | $498,641 | $141,551 | $357,090 |
| 2024 | $6,705 | $488,865 | $138,776 | $350,089 |
| 2023 | $6,524 | $479,280 | $136,055 | $343,225 |
| 2022 | $6,552 | $469,884 | $133,388 | $336,496 |
| 2021 | $6,437 | $460,672 | $130,773 | $329,899 |
| 2019 | $6,202 | $447,011 | $126,896 | $320,115 |
| 2018 | $6,057 | $438,247 | $124,408 | $313,839 |
| 2016 | $6,083 | $421,231 | $119,578 | $301,653 |
| 2015 | $5,870 | $414,904 | $117,782 | $297,122 |
| 2014 | $5,782 | $406,777 | $115,475 | $291,302 |
Source: Public Records
Map
Nearby Homes
- 21983 Centurion Way
- 27547 Saffron Ln
- 21929 Peppercorn Dr
- 21827 Centurion Way
- 27610 Kevin Place
- 27502 Caraway Ln
- 27571 Caraway Ln
- 22346 Cheraw Dr
- 27632 Kevin Place
- 27619 Ron Ridge Dr
- 27215 Elias Ave
- 27231 Cabrera Ave
- 21643 Masterson Ct
- 22403 Los Rogues Dr
- 21560 Quinn Place
- 22123 Alamogordo Rd
- 27620 Susan Beth Way Unit A
- 27127 Rio Bosque Dr
- 27021 Rio Bosque Dr
- 21741 Jeffers Ln
- 22011 Pamplico Dr
- 22003 Pamplico Dr
- 22015 Pamplico Dr
- 22001 Pamplico Dr
- 22019 Pamplico Dr
- 22010 Pamplico Dr
- 22014 Pamplico Dr
- 22018 Pamplico Dr
- 22023 Pamplico Dr
- 22000 Pamplico Dr
- 22006 Pamplico Dr
- 22002 Pamplico Dr
- 22022 Pamplico Dr
- 22027 Pamplico Dr
- 22042 Pamplico Dr
- 22118 Scallion Dr
- 22114 Scallion Dr
- 22124 Scallion Dr
- 22108 Scallion Dr
- 22128 Scallion Dr