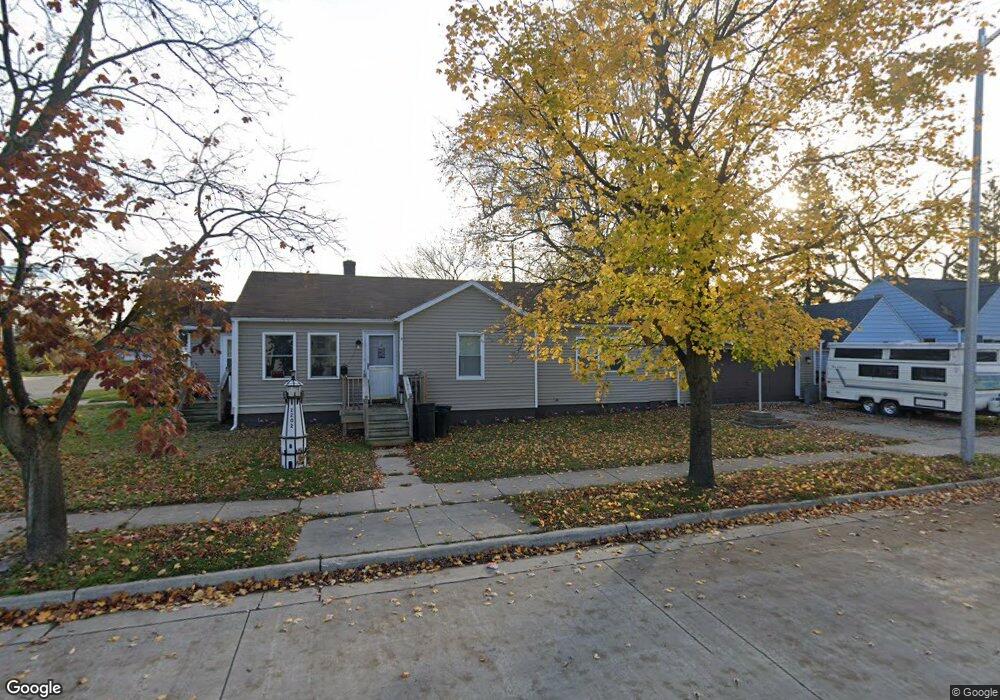
2202 Oak St Port Huron, MI 48060
Estimated Value: $123,000 - $165,000
3
Beds
1
Bath
1,154
Sq Ft
$124/Sq Ft
Est. Value
About This Home
This home is located at 2202 Oak St, Port Huron, MI 48060 and is currently estimated at $142,729, approximately $123 per square foot. 2202 Oak St is a home located in St. Clair County with nearby schools including Michigamme Elementary School, Central Middle School, and Port Huron High School.
Ownership History
Date
Name
Owned For
Owner Type
Purchase Details
Closed on
Oct 28, 2014
Sold by
Roosevelt Franklin and Roosevelt Katie
Bought by
Asset Link Llc
Current Estimated Value
Purchase Details
Closed on
Sep 23, 2014
Sold by
Saint Clair County Treasurer
Bought by
Asset Link Llc
Purchase Details
Closed on
Apr 21, 2006
Sold by
Roosevelt Ramona J
Bought by
Roosevelt Franklin and Roosevelt Katie
Home Financials for this Owner
Home Financials are based on the most recent Mortgage that was taken out on this home.
Original Mortgage
$95,000
Interest Rate
6.39%
Mortgage Type
New Conventional
Create a Home Valuation Report for This Property
The Home Valuation Report is an in-depth analysis detailing your home's value as well as a comparison with similar homes in the area
Home Values in the Area
Average Home Value in this Area
Purchase History
| Date | Buyer | Sale Price | Title Company |
|---|---|---|---|
| Asset Link Llc | -- | None Available | |
| Asset Link Llc | $16,250 | None Available | |
| Roosevelt Franklin | -- | Crossroads Title |
Source: Public Records
Mortgage History
| Date | Status | Borrower | Loan Amount |
|---|---|---|---|
| Previous Owner | Roosevelt Franklin | $95,000 |
Source: Public Records
Tax History Compared to Growth
Tax History
| Year | Tax Paid | Tax Assessment Tax Assessment Total Assessment is a certain percentage of the fair market value that is determined by local assessors to be the total taxable value of land and additions on the property. | Land | Improvement |
|---|---|---|---|---|
| 2025 | $2,074 | $60,700 | $0 | $0 |
| 2024 | $1,806 | $58,700 | $0 | $0 |
| 2023 | $1,710 | $52,500 | $0 | $0 |
| 2022 | $1,701 | $43,900 | $0 | $0 |
| 2021 | $1,624 | $40,200 | $0 | $0 |
| 2020 | $1,631 | $35,100 | $35,100 | $0 |
| 2019 | $1,602 | $25,200 | $0 | $0 |
| 2018 | $1,566 | $25,200 | $0 | $0 |
| 2017 | $1,437 | $23,700 | $0 | $0 |
| 2016 | $1,276 | $23,700 | $0 | $0 |
| 2015 | $1,336 | $23,700 | $23,700 | $0 |
| 2014 | $1,336 | $24,800 | $24,800 | $0 |
| 2013 | -- | $27,700 | $0 | $0 |
Source: Public Records
Map
Nearby Homes