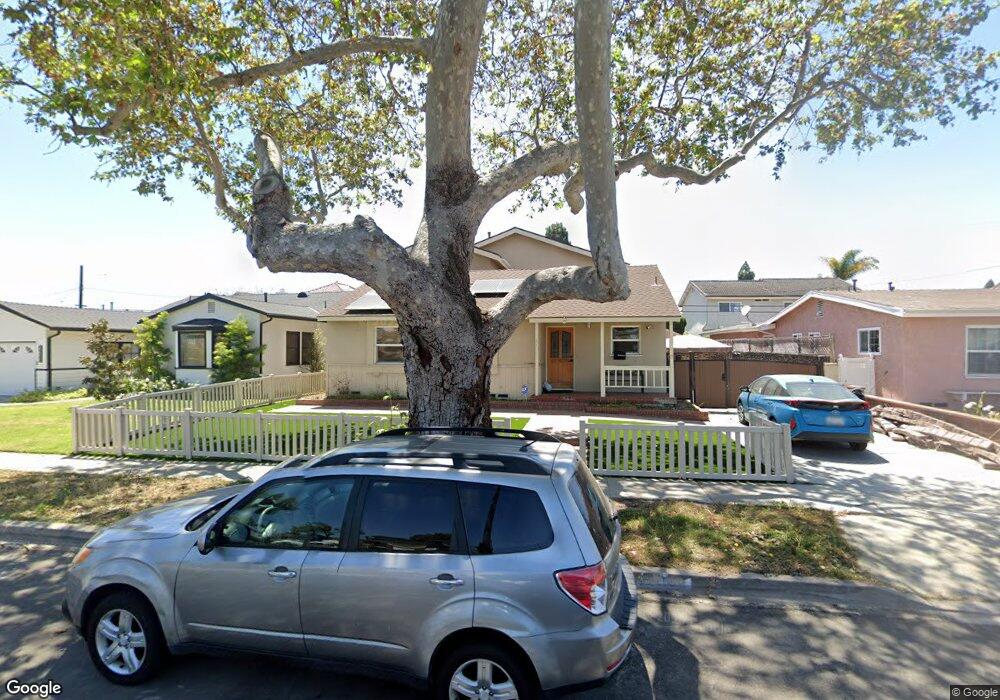
22021 Anza Ave Torrance, CA 90503
Southwood NeighborhoodEstimated Value: $1,448,000 - $1,689,967
3
Beds
2
Baths
1,462
Sq Ft
$1,053/Sq Ft
Est. Value
About This Home
This home is located at 22021 Anza Ave, Torrance, CA 90503 and is currently estimated at $1,539,242, approximately $1,052 per square foot. 22021 Anza Ave is a home located in Los Angeles County with nearby schools including Anza Elementary School, Jefferson Middle School, and West High School.
Ownership History
Date
Name
Owned For
Owner Type
Purchase Details
Closed on
Aug 3, 2006
Sold by
Delaterre Lance
Bought by
Peracha Ahmed and Peracha Zarmina
Current Estimated Value
Home Financials for this Owner
Home Financials are based on the most recent Mortgage that was taken out on this home.
Original Mortgage
$536,000
Outstanding Balance
$319,088
Interest Rate
6.7%
Mortgage Type
Purchase Money Mortgage
Estimated Equity
$1,220,154
Purchase Details
Closed on
Jun 26, 1997
Sold by
Berthel Deborah
Bought by
Franzman Thomas
Home Financials for this Owner
Home Financials are based on the most recent Mortgage that was taken out on this home.
Original Mortgage
$206,800
Interest Rate
7.54%
Purchase Details
Closed on
May 28, 1997
Sold by
Franzman Thomas
Bought by
Delaterre Lance and Delaterre Pamela
Home Financials for this Owner
Home Financials are based on the most recent Mortgage that was taken out on this home.
Original Mortgage
$206,800
Interest Rate
7.54%
Create a Home Valuation Report for This Property
The Home Valuation Report is an in-depth analysis detailing your home's value as well as a comparison with similar homes in the area
Home Values in the Area
Average Home Value in this Area
Purchase History
| Date | Buyer | Sale Price | Title Company |
|---|---|---|---|
| Peracha Ahmed | $670,000 | First American Title Co | |
| Franzman Thomas | -- | Continental Lawyers Title Co | |
| Delaterre Lance | $261,000 | Continental Lawyers Title Co |
Source: Public Records
Mortgage History
| Date | Status | Borrower | Loan Amount |
|---|---|---|---|
| Open | Peracha Ahmed | $536,000 | |
| Previous Owner | Delaterre Lance | $206,800 | |
| Closed | Delaterre Lance | $38,750 |
Source: Public Records
Tax History Compared to Growth
Tax History
| Year | Tax Paid | Tax Assessment Tax Assessment Total Assessment is a certain percentage of the fair market value that is determined by local assessors to be the total taxable value of land and additions on the property. | Land | Improvement |
|---|---|---|---|---|
| 2025 | $11,680 | $1,036,977 | $718,120 | $318,857 |
| 2024 | $11,680 | $1,016,645 | $704,040 | $312,605 |
| 2023 | $11,463 | $996,712 | $690,236 | $306,476 |
| 2022 | $11,309 | $977,169 | $676,702 | $300,467 |
| 2021 | $11,102 | $958,010 | $663,434 | $294,576 |
| 2019 | $10,778 | $929,597 | $643,757 | $285,840 |
| 2018 | $10,459 | $911,371 | $631,135 | $280,236 |
| 2016 | $9,990 | $875,983 | $606,628 | $269,355 |
| 2015 | $9,772 | $862,826 | $597,516 | $265,310 |
| 2014 | $9,510 | $845,925 | $585,812 | $260,113 |
Source: Public Records
Map
Nearby Homes
- 4402 Cathann St
- 22305 Ladeene Ave
- 22404 Reynolds Dr
- 22516 Marjorie Ave
- 22721 Marjorie Ave
- 21625 Bernice Ave
- 21345 Hawthorne Blvd Unit 217
- 22828 Anza Ave
- 21513 Palos Verdes Blvd
- 22933 Galva Ave
- 22709 Gaycrest Ave
- 4226 W 230th Place
- 1108 Camino Real Unit 407
- 1108 Camino Real Unit 306
- 5608 Palos Verdes Blvd
- 4817 Macafee Rd
- 4826 Maricopa St
- 4830 Maricopa St
- 4814 Asteria St
- 904 Knob Hill Ave
- 22017 Anza Ave
- 22025 Anza Ave
- 22026 Kathryn Ave
- 22013 Anza Ave
- 22029 Anza Ave
- 22020 Kathryn Ave
- 22032 Kathryn Ave
- 22036 Kathryn Ave
- 22033 Anza Ave
- 22009 Anza Ave
- 4501 Laurette St
- 4509 Laurette St
- 22040 Kathryn Ave
- 22005 Anza Ave
- 22037 Anza Ave
- 4510 Laurette St
- 4515 Laurette St
- 4505 Cathann St
- 22024 Anza Ave
- 22022 Anza Ave