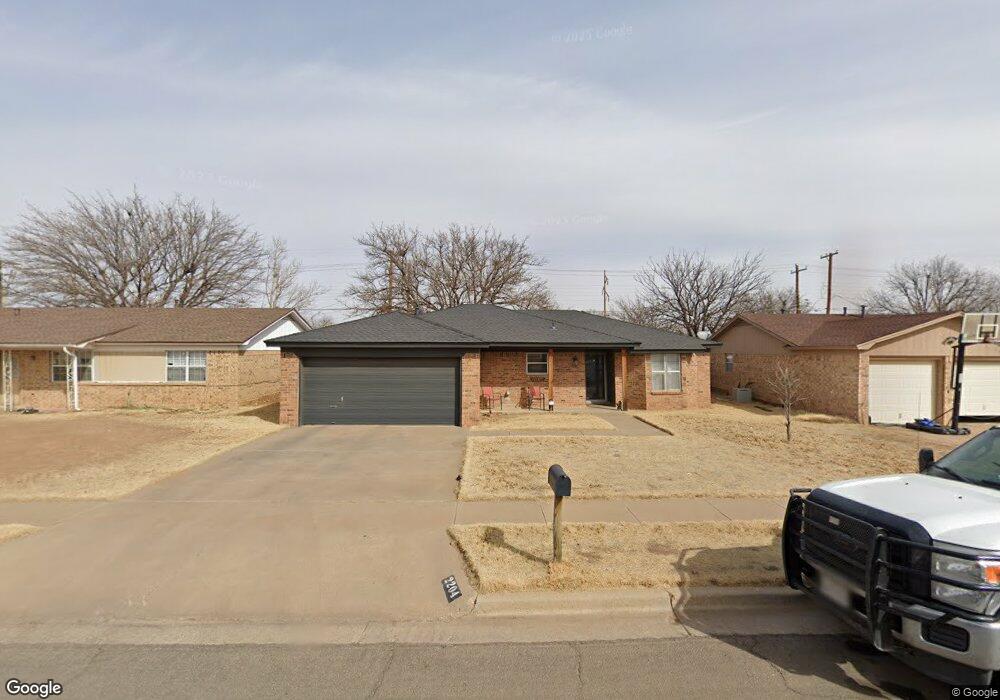
2204 75th St Lubbock, TX 79423
South Lubbock NeighborhoodEstimated Value: $164,000 - $173,000
3
Beds
2
Baths
1,346
Sq Ft
$125/Sq Ft
Est. Value
About This Home
This home is located at 2204 75th St, Lubbock, TX 79423 and is currently estimated at $168,197, approximately $124 per square foot. 2204 75th St is a home located in Lubbock County with nearby schools including Roy W. Roberts Elementary School, Atkins Middle School, and Monterey High School.
Ownership History
Date
Name
Owned For
Owner Type
Purchase Details
Closed on
Jun 4, 2021
Sold by
Peterson Megan
Bought by
Peterson Adam
Current Estimated Value
Home Financials for this Owner
Home Financials are based on the most recent Mortgage that was taken out on this home.
Original Mortgage
$94,200
Outstanding Balance
$85,286
Interest Rate
2.9%
Mortgage Type
New Conventional
Estimated Equity
$82,911
Purchase Details
Closed on
Sep 16, 2016
Sold by
Langlitz Nani S and Spears Nani
Bought by
Peterson Adam and Peterson Megan
Home Financials for this Owner
Home Financials are based on the most recent Mortgage that was taken out on this home.
Original Mortgage
$96,715
Interest Rate
3.25%
Mortgage Type
FHA
Purchase Details
Closed on
Dec 31, 1987
Sold by
Patton Gail D
Bought by
Peterson Adam and Peterson Meagan
Create a Home Valuation Report for This Property
The Home Valuation Report is an in-depth analysis detailing your home's value as well as a comparison with similar homes in the area
Home Values in the Area
Average Home Value in this Area
Purchase History
| Date | Buyer | Sale Price | Title Company |
|---|---|---|---|
| Peterson Adam | -- | None Available | |
| Peterson Adam | -- | Stewart Title Of Lubbock Inc | |
| Peterson Adam | -- | -- |
Source: Public Records
Mortgage History
| Date | Status | Borrower | Loan Amount |
|---|---|---|---|
| Open | Peterson Adam | $94,200 | |
| Closed | Peterson Adam | $96,715 |
Source: Public Records
Tax History Compared to Growth
Tax History
| Year | Tax Paid | Tax Assessment Tax Assessment Total Assessment is a certain percentage of the fair market value that is determined by local assessors to be the total taxable value of land and additions on the property. | Land | Improvement |
|---|---|---|---|---|
| 2025 | $2,180 | $166,793 | $25,000 | $141,793 |
| 2024 | $2,180 | $170,084 | $12,840 | $157,244 |
| 2023 | $2,955 | $158,980 | $12,840 | $146,140 |
| 2022 | $2,926 | $144,527 | $12,840 | $131,794 |
| 2021 | $2,814 | $131,388 | $12,840 | $118,548 |
| 2020 | $2,754 | $126,646 | $12,840 | $113,806 |
| 2019 | $2,595 | $115,581 | $12,840 | $102,741 |
| 2018 | $2,403 | $106,889 | $12,840 | $94,049 |
| 2017 | $2,406 | $106,889 | $12,840 | $94,049 |
| 2016 | $2,210 | $98,195 | $12,840 | $85,355 |
| 2015 | $1,842 | $89,630 | $12,840 | $76,790 |
| 2014 | $1,842 | $82,849 | $4,800 | $78,049 |
Source: Public Records
Map
Nearby Homes