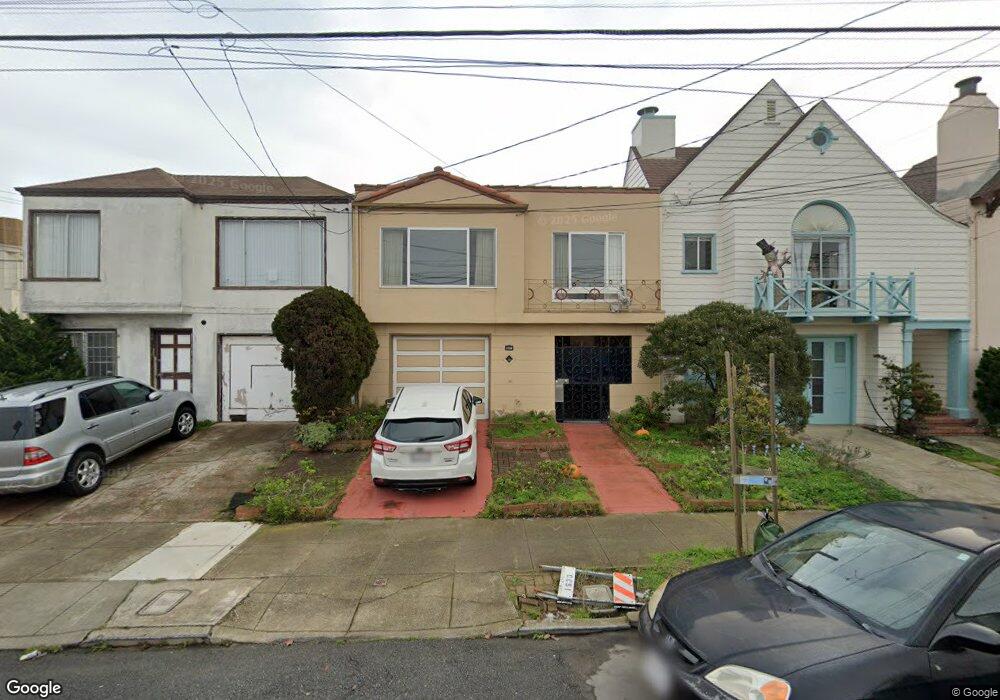
2206 33rd Ave San Francisco, CA 94116
Parkside NeighborhoodEstimated Value: $1,186,940 - $1,690,000
--
Bed
1
Bath
1,390
Sq Ft
$1,006/Sq Ft
Est. Value
About This Home
This home is located at 2206 33rd Ave, San Francisco, CA 94116 and is currently estimated at $1,398,485, approximately $1,006 per square foot. 2206 33rd Ave is a home located in San Francisco County with nearby schools including Stevenson (Robert Louis) Elementary School, Giannini (A.P.) Middle School, and St. Gabriel School.
Ownership History
Date
Name
Owned For
Owner Type
Purchase Details
Closed on
Sep 28, 2023
Sold by
Gregory Mitchell Patrick and Gregory Tamara Jean
Bought by
Gregory Revocable Trust and Gregory
Current Estimated Value
Purchase Details
Closed on
Nov 2, 2020
Sold by
Trutner Kurt and Trutner James R
Bought by
Gregory Tami
Purchase Details
Closed on
Oct 13, 2016
Sold by
Edwards James R
Bought by
Edwards James R and Schmierer Caron
Purchase Details
Closed on
Apr 29, 2008
Sold by
Edwards James R
Bought by
Edwards James R
Create a Home Valuation Report for This Property
The Home Valuation Report is an in-depth analysis detailing your home's value as well as a comparison with similar homes in the area
Home Values in the Area
Average Home Value in this Area
Purchase History
| Date | Buyer | Sale Price | Title Company |
|---|---|---|---|
| Gregory Revocable Trust | -- | None Listed On Document | |
| Gregory Tami | -- | None Available | |
| Edwards James R | -- | None Available | |
| Edwards James R | -- | None Available |
Source: Public Records
Tax History Compared to Growth
Tax History
| Year | Tax Paid | Tax Assessment Tax Assessment Total Assessment is a certain percentage of the fair market value that is determined by local assessors to be the total taxable value of land and additions on the property. | Land | Improvement |
|---|---|---|---|---|
| 2025 | $1,831 | $90,729 | $35,773 | $54,956 |
| 2024 | $1,831 | $88,951 | $35,072 | $53,879 |
| 2023 | $1,793 | $87,208 | $34,385 | $52,823 |
| 2022 | $1,741 | $85,499 | $33,711 | $51,788 |
| 2021 | $1,705 | $83,823 | $33,050 | $50,773 |
| 2020 | $1,784 | $82,965 | $32,712 | $50,253 |
| 2019 | $1,680 | $81,339 | $32,071 | $49,268 |
| 2018 | $1,626 | $79,745 | $31,443 | $48,302 |
| 2017 | $1,308 | $78,182 | $30,827 | $47,355 |
| 2016 | $1,256 | $76,650 | $30,223 | $46,427 |
| 2015 | $1,238 | $75,500 | $29,770 | $45,730 |
| 2014 | $1,207 | $74,022 | $29,187 | $44,835 |
Source: Public Records
Map
Nearby Homes