221 Holland Dr Denison, TX 75020
Estimated Value: $307,465 - $327,000
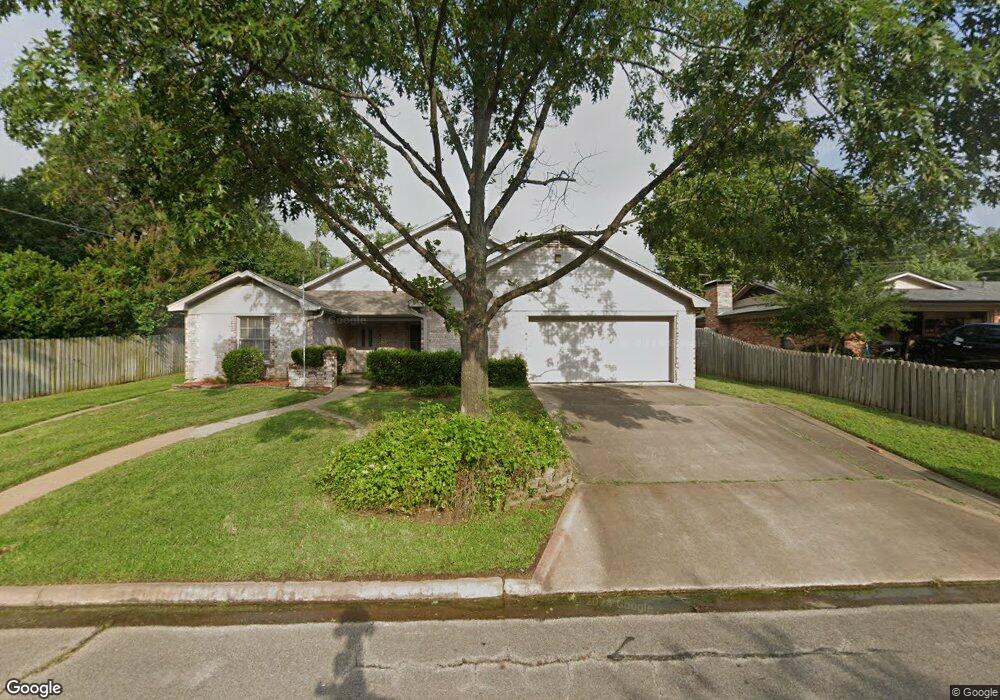
About This Home
Property Id: 1462375
Seriously, have a look at comparably large houses in the Denison area, then have a look at this one. This house has an abundance of living area, workshop area (conditioned) huge amount of cabinetry throughout, large fenced yard, and two outdoor living areas. This home was designed and built by an engineer and it shows like it! It has been freshly pained, new carpet, new fence, and there is an option for ALL NEW APPLIANCES. It has granite counter tops, a huge great room/kitchen, with access to a nice patio for entertaining. The master bedroom is over sized with a walk in closet that has more square footage than some bedrooms have, plus a built in dresser and cedar closet. Have look at the pictures, as they speak for themselves, then come see in person! I'm available seven days a week. I'm not a listing agent, I'M THE OWNER.
Ownership History
Purchase Details
Home Values in the Area
Average Home Value in this Area
Purchase History
| Date | Buyer | Sale Price | Title Company |
|---|---|---|---|
| Bohannan Rodney L | -- | None Listed On Document |
Property History
| Date | Event | Price | List to Sale | Price per Sq Ft |
|---|---|---|---|---|
| 11/29/2024 11/29/24 | Off Market | $1,850 | -- | -- |
| 11/21/2024 11/21/24 | For Rent | $1,850 | -- | -- |
Tax History Compared to Growth
Tax History
| Year | Tax Paid | Tax Assessment Tax Assessment Total Assessment is a certain percentage of the fair market value that is determined by local assessors to be the total taxable value of land and additions on the property. | Land | Improvement |
|---|---|---|---|---|
| 2025 | $7,138 | $307,424 | $54,000 | $253,424 |
| 2024 | $7,138 | $307,232 | $46,080 | $261,152 |
| 2023 | $6,749 | $297,877 | $44,370 | $253,507 |
| 2022 | $6,539 | $275,218 | $44,370 | $230,848 |
| 2021 | $5,436 | $215,523 | $31,680 | $183,843 |
| 2020 | $5,871 | $222,578 | $17,910 | $204,668 |
| 2019 | $5,923 | $215,241 | $17,910 | $197,331 |
| 2018 | $5,527 | $199,248 | $14,850 | $184,398 |
| 2017 | $5,146 | $183,949 | $13,050 | $170,899 |
| 2016 | $4,788 | $171,159 | $12,690 | $158,469 |
| 2015 | $2,606 | $148,396 | $8,550 | $139,846 |
| 2014 | $2,756 | $148,396 | $8,550 | $139,846 |
Map
- 2404 Miller St
- 2385 Miller St
- The Colorado Plan at Miller Street Cottages
- The Welsh Plan at Miller Street Cottages
- The Dales Plan at Miller Street Cottages
- The Kentucky Plan at Miller Street Cottages
- Exmoor Plan at Miller Street Cottages
- The Carolina Plan at Miller Street Cottages
- 2408 Miller St
- 2396 Miller St
- 2380 Miller St
- 2389 Miller St
- 2413 Miller St
- 2381 Miller St
- 2373 Miller St
- 2400 Miller St
- 131 S Imperial Dr
- 509 Bryan Dr
- 110 S Hickory Ave
- Flora ,TBD Flora Ln