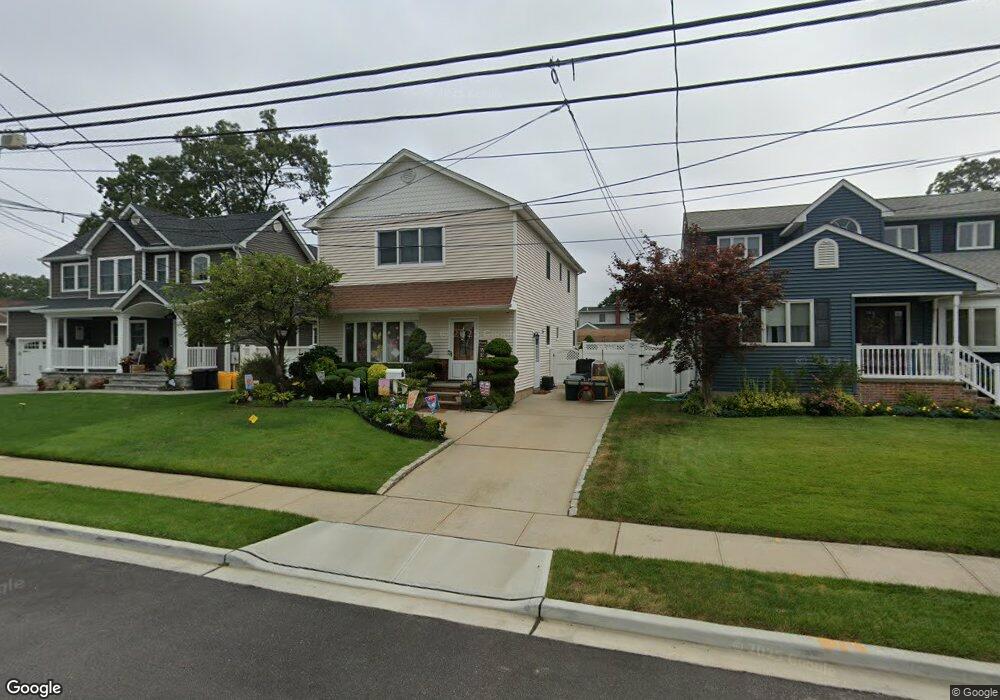
221 Oak St Massapequa Park, NY 11762
Estimated Value: $781,506 - $961,000
--
Bed
3
Baths
2,150
Sq Ft
$405/Sq Ft
Est. Value
About This Home
This home is located at 221 Oak St, Massapequa Park, NY 11762 and is currently estimated at $871,253, approximately $405 per square foot. 221 Oak St is a home located in Nassau County with nearby schools including Massapequa High School - Ames Campus, Berner Middle School, and Massapequa High School.
Ownership History
Date
Name
Owned For
Owner Type
Purchase Details
Closed on
Dec 13, 2005
Sold by
Prusan Eric
Current Estimated Value
Purchase Details
Closed on
Jun 3, 1996
Sold by
Tortorella Anthony and Tortorella Francine
Bought by
Prusan Eric and Buccheri Rosemary
Home Financials for this Owner
Home Financials are based on the most recent Mortgage that was taken out on this home.
Original Mortgage
$145,200
Interest Rate
8.21%
Create a Home Valuation Report for This Property
The Home Valuation Report is an in-depth analysis detailing your home's value as well as a comparison with similar homes in the area
Home Values in the Area
Average Home Value in this Area
Purchase History
| Date | Buyer | Sale Price | Title Company |
|---|---|---|---|
| -- | -- | -- | |
| Prusan Eric | $181,500 | -- |
Source: Public Records
Mortgage History
| Date | Status | Borrower | Loan Amount |
|---|---|---|---|
| Previous Owner | Prusan Eric | $145,200 |
Source: Public Records
Tax History Compared to Growth
Tax History
| Year | Tax Paid | Tax Assessment Tax Assessment Total Assessment is a certain percentage of the fair market value that is determined by local assessors to be the total taxable value of land and additions on the property. | Land | Improvement |
|---|---|---|---|---|
| 2025 | $13,557 | $542 | $156 | $386 |
| 2024 | $3,512 | $527 | $152 | $375 |
| 2023 | $11,649 | $545 | $157 | $388 |
| 2022 | $11,649 | $545 | $157 | $388 |
| 2021 | $10,810 | $535 | $154 | $381 |
| 2020 | $10,017 | $592 | $514 | $78 |
| 2019 | $8,534 | $634 | $515 | $119 |
| 2018 | $8,436 | $677 | $0 | $0 |
| 2017 | $5,762 | $719 | $520 | $199 |
| 2016 | $8,509 | $761 | $411 | $350 |
| 2015 | $2,714 | $804 | $434 | $370 |
| 2014 | $2,714 | $804 | $434 | $370 |
| 2013 | $3,219 | $1,019 | $550 | $469 |
Source: Public Records
Map
Nearby Homes