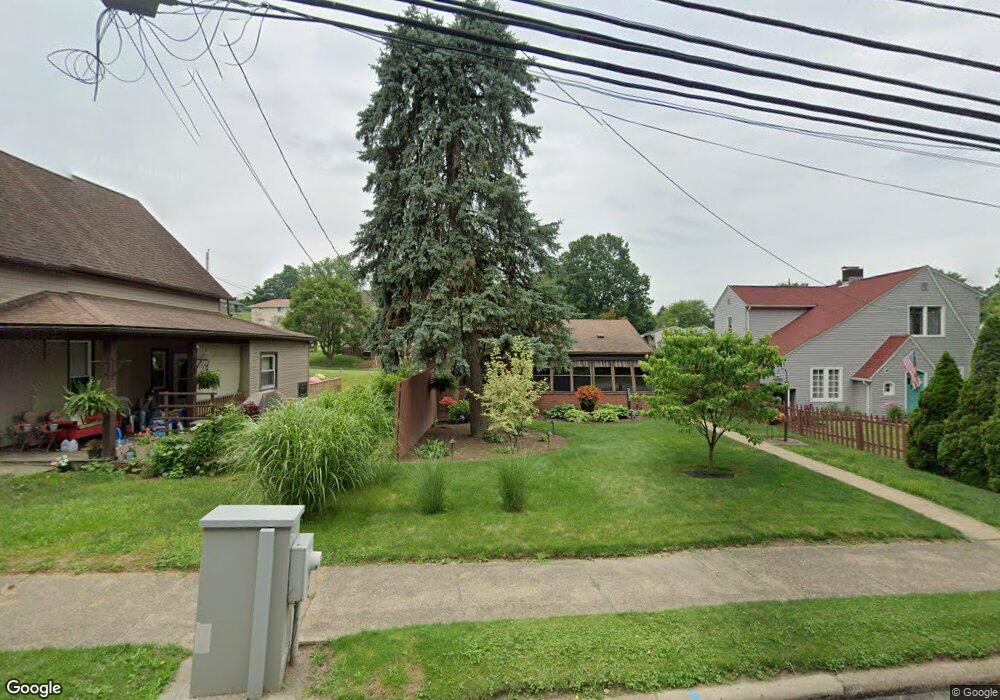
2211 Saint Clair Ave East Liverpool, OH 43920
Estimated Value: $113,000 - $139,000
2
Beds
2
Baths
768
Sq Ft
$162/Sq Ft
Est. Value
About This Home
This home is located at 2211 Saint Clair Ave, East Liverpool, OH 43920 and is currently estimated at $124,326, approximately $161 per square foot. 2211 Saint Clair Ave is a home located in Columbiana County with nearby schools including Westgate Middle School, North Elementary School, and East Liverpool High School.
Ownership History
Date
Name
Owned For
Owner Type
Purchase Details
Closed on
Apr 26, 2019
Bought by
Kidd Julie A and Kidd Craig S
Current Estimated Value
Purchase Details
Closed on
Apr 7, 2006
Sold by
Wolfe Debra S and Wolfe Daniel D
Bought by
Boyd Julie A and Kidd Craig S
Home Financials for this Owner
Home Financials are based on the most recent Mortgage that was taken out on this home.
Original Mortgage
$57,820
Interest Rate
6.33%
Mortgage Type
Purchase Money Mortgage
Purchase Details
Closed on
Jun 17, 2005
Sold by
Diddle Jean C and Perkins Marion L
Bought by
Wolfe Debra S
Home Financials for this Owner
Home Financials are based on the most recent Mortgage that was taken out on this home.
Original Mortgage
$60,000
Interest Rate
5.86%
Mortgage Type
Purchase Money Mortgage
Purchase Details
Closed on
Jun 15, 1998
Sold by
Sullivan William
Bought by
Diddle Jean C and Perkins Marion L
Purchase Details
Closed on
Nov 23, 1990
Bought by
Sullivan William
Create a Home Valuation Report for This Property
The Home Valuation Report is an in-depth analysis detailing your home's value as well as a comparison with similar homes in the area
Home Values in the Area
Average Home Value in this Area
Purchase History
| Date | Buyer | Sale Price | Title Company |
|---|---|---|---|
| Kidd Julie A | -- | -- | |
| Boyd Julie A | $73,900 | None Available | |
| Wolfe Debra S | $75,000 | None Available | |
| Diddle Jean C | $62,000 | -- | |
| Sullivan William | $50,000 | -- |
Source: Public Records
Mortgage History
| Date | Status | Borrower | Loan Amount |
|---|---|---|---|
| Previous Owner | Boyd Julie A | $57,820 | |
| Previous Owner | Wolfe Debra S | $60,000 |
Source: Public Records
Tax History Compared to Growth
Tax History
| Year | Tax Paid | Tax Assessment Tax Assessment Total Assessment is a certain percentage of the fair market value that is determined by local assessors to be the total taxable value of land and additions on the property. | Land | Improvement |
|---|---|---|---|---|
| 2024 | $1,241 | $30,210 | $4,760 | $25,450 |
| 2023 | $1,241 | $30,210 | $4,760 | $25,450 |
| 2022 | $1,242 | $30,210 | $4,760 | $25,450 |
| 2021 | $1,108 | $24,710 | $4,760 | $19,950 |
| 2020 | $1,109 | $24,710 | $4,760 | $19,950 |
| 2019 | $1,139 | $24,710 | $4,760 | $19,950 |
| 2018 | $1,104 | $22,470 | $4,340 | $18,130 |
| 2017 | $1,162 | $22,470 | $4,340 | $18,130 |
| 2016 | $1,200 | $23,880 | $8,090 | $15,790 |
| 2015 | $1,200 | $23,880 | $8,090 | $15,790 |
| 2014 | $1,187 | $23,880 | $8,090 | $15,790 |
Source: Public Records
Map
Nearby Homes
- 628 Fisher Ave
- 316 Carolina Ave
- 1714 Allison St
- 0 Armstrong Ln
- 120 Woodbine
- 1519 Saint Clair Ave
- 1520 Smithfield St
- 1507 Saint Clair Ave
- 306 Imperial Dr
- 921 Orchard Grove Ave
- 3124 Gilson Ave
- 1178 Oliver St
- 920 Mckinnon Ave
- 3140 Curry St
- 925 Montgomery St
- 0 Kingsridge Rd
- 49536 Sunset Dr
- 3194 Forest Hills Dr
- 140 Huntington Ct
- 3170 Hampton Ct
- 2213 Saint Clair Ave
- 2203 Saint Clair Ave
- 2221 Saint Clair Ave
- 639 Blackmore St
- 644 Elson St
- 2121 Saint Clair Ave
- 2231 Saint Clair Ave
- 638 Blackmore St
- 2230 St Clair Avenue Ave
- 637 Blackmore St
- 2230 Saint Clair Ave
- 2119 Saint Clair Ave
- 2233 Saint Clair Ave
- 635 Blackmore St
- 2117 Saint Clair Ave
- 640 Blackmore St
- 637 Elson St
- 2235 Saint Clair Ave
- 2123 Saint Clair Ave
- 629 Blackmore St