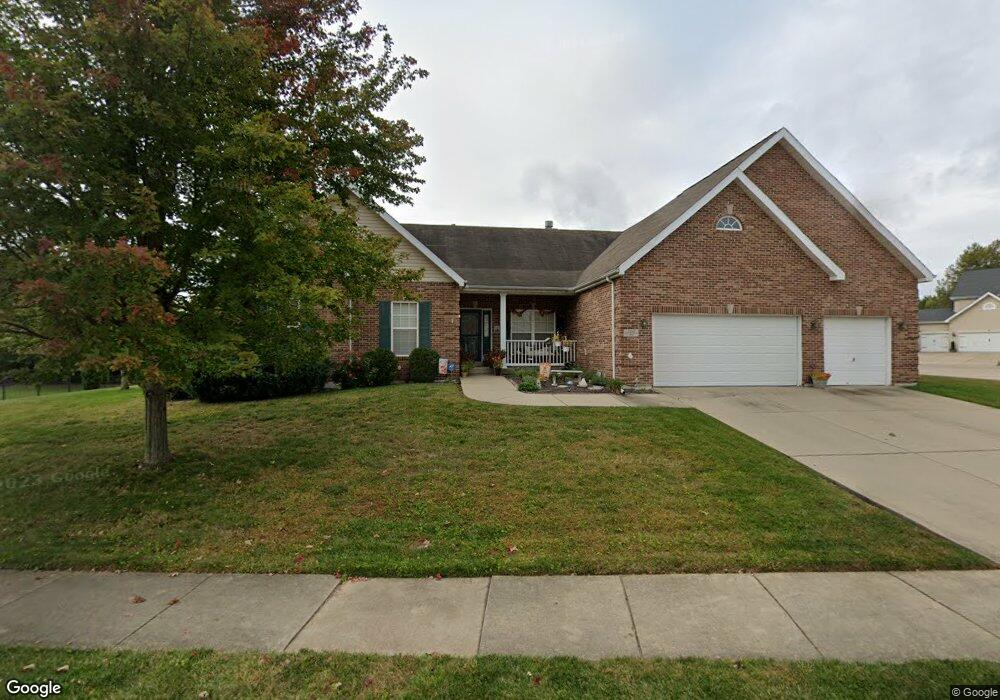
2212 Jack Nicklaus Dr Belleville, IL 62220
Estimated Value: $395,000 - $483,536
4
Beds
4
Baths
2,050
Sq Ft
$222/Sq Ft
Est. Value
About This Home
This home is located at 2212 Jack Nicklaus Dr, Belleville, IL 62220 and is currently estimated at $455,384, approximately $222 per square foot. 2212 Jack Nicklaus Dr is a home located in St. Clair County with nearby schools including Mascoutah High School and Zion Lutheran School Belleville.
Ownership History
Date
Name
Owned For
Owner Type
Purchase Details
Closed on
Feb 15, 2013
Sold by
Lance Michael E and Lance Catherine E
Bought by
Hornitschek Michael J and Hornitschek Polly A
Current Estimated Value
Home Financials for this Owner
Home Financials are based on the most recent Mortgage that was taken out on this home.
Original Mortgage
$200,000
Outstanding Balance
$139,098
Interest Rate
3.3%
Mortgage Type
New Conventional
Estimated Equity
$316,286
Purchase Details
Closed on
Aug 19, 2010
Sold by
Hunt Dicky and Melisa Hunt R
Bought by
Lance Michael E and Lance Catherine E
Purchase Details
Closed on
Jan 19, 2007
Sold by
Vantage Homes Of Illinois Llc
Bought by
Hunt Dicky and Melisa Hunt R
Home Financials for this Owner
Home Financials are based on the most recent Mortgage that was taken out on this home.
Original Mortgage
$293,581
Interest Rate
6.21%
Mortgage Type
VA
Purchase Details
Closed on
Mar 16, 2006
Sold by
Double Eagle Development Inc
Bought by
Vantage Homes Of Illinois Llc
Create a Home Valuation Report for This Property
The Home Valuation Report is an in-depth analysis detailing your home's value as well as a comparison with similar homes in the area
Home Values in the Area
Average Home Value in this Area
Purchase History
| Date | Buyer | Sale Price | Title Company |
|---|---|---|---|
| Hornitschek Michael J | $255,000 | Fatic | |
| Lance Michael E | $276,000 | Fatic | |
| Hunt Dicky | $284,500 | Benchmark Title Company | |
| Vantage Homes Of Illinois Llc | $645,000 | Benchmark Title Company |
Source: Public Records
Mortgage History
| Date | Status | Borrower | Loan Amount |
|---|---|---|---|
| Open | Hornitschek Michael J | $200,000 | |
| Previous Owner | Hunt Dicky | $293,581 |
Source: Public Records
Tax History Compared to Growth
Tax History
| Year | Tax Paid | Tax Assessment Tax Assessment Total Assessment is a certain percentage of the fair market value that is determined by local assessors to be the total taxable value of land and additions on the property. | Land | Improvement |
|---|---|---|---|---|
| 2024 | $9,631 | $133,755 | $30,879 | $102,876 |
| 2023 | $9,406 | $124,626 | $30,267 | $94,359 |
| 2022 | $8,823 | $112,195 | $27,248 | $84,947 |
| 2021 | $8,356 | $103,721 | $25,190 | $78,531 |
| 2020 | $8,173 | $99,400 | $23,822 | $75,578 |
| 2019 | $7,941 | $96,204 | $23,859 | $72,345 |
| 2018 | $7,716 | $94,124 | $23,343 | $70,781 |
| 2017 | $8,047 | $93,463 | $23,179 | $70,284 |
| 2016 | $8,137 | $91,478 | $22,687 | $68,791 |
| 2014 | $6,711 | $86,819 | $24,398 | $62,421 |
| 2013 | $6,865 | $88,061 | $24,747 | $63,314 |
Source: Public Records
Map
Nearby Homes
- 2832 Fairway Dr
- 2826 Brookmeadow Dr
- 1609 10th Fairway Dr
- 2793 Brookmeadow Dr
- 262 Eastbrook Dr
- 255 Brookmont Dr
- 2917 18th Fairway Dr
- 240 Brookmont Dr
- 2701 Brookmeadow Dr
- 1566 Orchard Lakes Cir
- 2655 Brookmeadow Dr
- 1514 Orchard Lakes Cir
- 1338 Orchard Lakes Cir
- 3225 Margaret Mary Ln
- Sunrise Plan at Orchard Lakes
- Bristol Villa Plan at Orchard Lakes
- Hannah Plan at Orchard Lakes
- Winchester A Plan at Orchard Lakes
- Herndon Plan at Orchard Lakes
- Scarlett Plan at Orchard Lakes
- 2216 Jack Nicklaus Dr
- 2200 Jack Nicklaus Dr
- 2239 Arnold Palmer Dr
- 2205 Jack Nicklaus Dr
- 2245 Arnold Palmer Dr
- 2217 Jack Nicklaus Dr
- 2231 Arnold Palmer Dr
- 2213 Jack Nicklaus Dr
- 2209 Jack Nicklaus Dr
- 2201 Jack Nicklaus Dr
- 2221 Jack Nicklaus Dr
- 2249 Arnold Palmer Dr
- 2225 Arnold Palmer Dr
- 165211th Fairway
- 2225 Jack Nicklaus Dr
- 2406 Fairway Dr
- 2410 Fairway Dr
- 2234 Arnold Palmer Dr
- 2238 Arnold Palmer Dr
- 2414 Fairway Dr