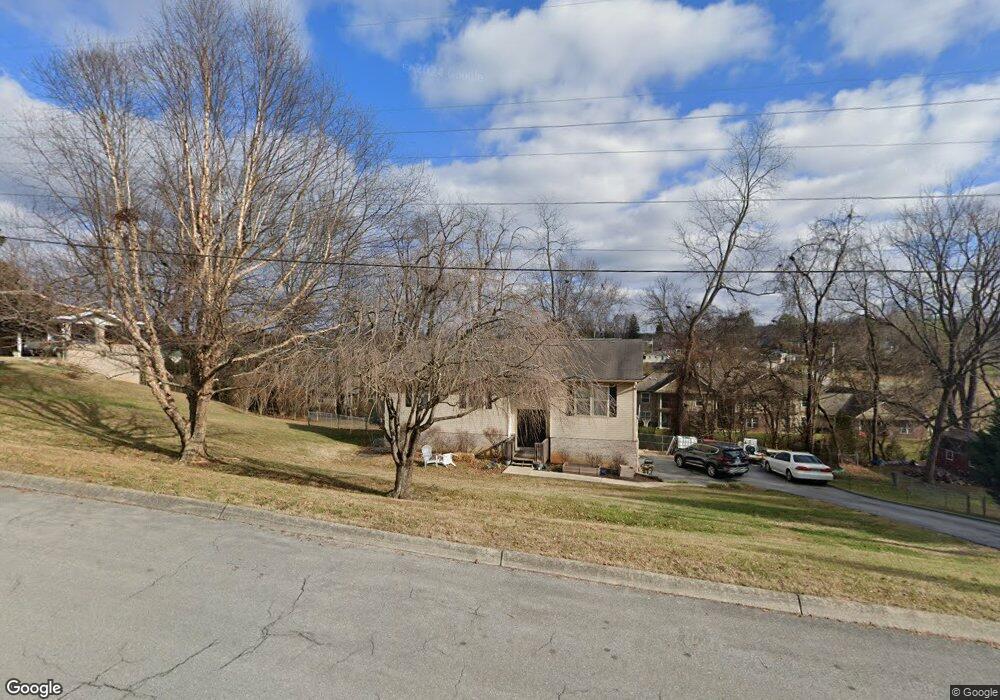
2212 Ridgefield Dr Johnson City, TN 37601
Estimated Value: $322,000 - $366,000
4
Beds
3
Baths
2,068
Sq Ft
$167/Sq Ft
Est. Value
About This Home
This home is located at 2212 Ridgefield Dr, Johnson City, TN 37601 and is currently estimated at $346,200, approximately $167 per square foot. 2212 Ridgefield Dr is a home located in Washington County with nearby schools including Mountain View Elementary School, Liberty Bell Middle School, and Indian Trail Middle School.
Ownership History
Date
Name
Owned For
Owner Type
Purchase Details
Closed on
Mar 28, 2008
Sold by
Anderson Troy T
Bought by
Shanks Jeremy A
Current Estimated Value
Home Financials for this Owner
Home Financials are based on the most recent Mortgage that was taken out on this home.
Original Mortgage
$157,500
Outstanding Balance
$101,063
Interest Rate
6.22%
Estimated Equity
$245,137
Purchase Details
Closed on
Apr 17, 2003
Sold by
Norris Jeffrey L
Bought by
Anderson Troy T
Home Financials for this Owner
Home Financials are based on the most recent Mortgage that was taken out on this home.
Original Mortgage
$112,100
Interest Rate
8.52%
Purchase Details
Closed on
Jul 30, 1999
Sold by
Dunlap Randy L and Dunlap Reba Y
Bought by
Norris Jeffrey L
Purchase Details
Closed on
Jan 13, 1999
Bought by
Campbell Linda G and Adams Stacey G
Purchase Details
Closed on
Apr 1, 1998
Sold by
Dunlap Randy L and Dunlap Reba Y
Bought by
Dunlap Randy L and Dunlap Reba Y
Purchase Details
Closed on
Mar 19, 1998
Sold by
Graham Shelia
Bought by
Dunlap Randy L and Dunlap Reba Y
Purchase Details
Closed on
Mar 28, 1997
Bought by
Graham Shelia
Create a Home Valuation Report for This Property
The Home Valuation Report is an in-depth analysis detailing your home's value as well as a comparison with similar homes in the area
Home Values in the Area
Average Home Value in this Area
Purchase History
| Date | Buyer | Sale Price | Title Company |
|---|---|---|---|
| Shanks Jeremy A | $158,000 | -- | |
| Anderson Troy T | $118,000 | -- | |
| Norris Jeffrey L | $116,000 | -- | |
| Campbell Linda G | $117,900 | -- | |
| Dunlap Randy L | -- | -- | |
| Dunlap Randy L | $14,000 | -- | |
| Graham Shelia | $5,000 | -- |
Source: Public Records
Mortgage History
| Date | Status | Borrower | Loan Amount |
|---|---|---|---|
| Open | Graham Shelia | $157,500 | |
| Previous Owner | Graham Shelia | $112,100 |
Source: Public Records
Tax History Compared to Growth
Tax History
| Year | Tax Paid | Tax Assessment Tax Assessment Total Assessment is a certain percentage of the fair market value that is determined by local assessors to be the total taxable value of land and additions on the property. | Land | Improvement |
|---|---|---|---|---|
| 2024 | $1,261 | $73,725 | $8,650 | $65,075 |
| 2022 | $964 | $44,850 | $8,650 | $36,200 |
| 2021 | $1,740 | $44,850 | $8,650 | $36,200 |
| 2020 | $1,731 | $44,850 | $8,650 | $36,200 |
| 2019 | $901 | $44,850 | $8,650 | $36,200 |
| 2018 | $1,616 | $37,850 | $4,675 | $33,175 |
| 2017 | $1,616 | $37,850 | $4,675 | $33,175 |
| 2016 | $1,609 | $37,850 | $4,675 | $33,175 |
| 2015 | $1,457 | $37,850 | $4,675 | $33,175 |
| 2014 | $1,363 | $37,850 | $4,675 | $33,175 |
Source: Public Records
Map
Nearby Homes
- 907 Cedar Grove Rd
- 1704 Orlando Dr
- Tbd Swadley Rd
- 322 Preservation Cir
- 197 Woodland Dr
- 805 E Maple St
- 188 Arlington Dr
- 101 Glaze Farm Way
- 40 Glaze Farm Way
- 94 Glaze Farm Way
- 45 Glaze Farm Way
- 35 Glaze Farm Way
- 31 Glaze Farm Way
- 60 Glaze Farm Way
- 70 Glaze Farm Way
- 24 Glaze Farm Way
- 65 Glaze Farm Way
- 10 Glaze Farm Way
- 14 Glaze Farm Way
- 90 Glaze Farm Way
- 2214 Ridgefield Dr
- 2205 Ridgefield Dr
- 2209 Ridgefield Dr
- 2208 Ridgefield Dr
- 909 Cedar Grove Rd
- 2203 Ridgefield Dr
- 2218 Ridgefield Dr
- 2206 Ridgefield Dr
- 2215 Ridgefield Dr
- 2204 Ridgefield Dr
- 2201 Ridgefield Dr
- 2202 Ridgefield Dr
- 1000 Ridgefield Cir
- 806 Ridgefield Dr
- 804 Ridgefield Dr
- 913 Cedar Grove Rd
- 915 Cedar Grove Rd
- 903 Ridgefield Dr
- 905 Ridgefield Dr
- 917 Cedar Grove Rd