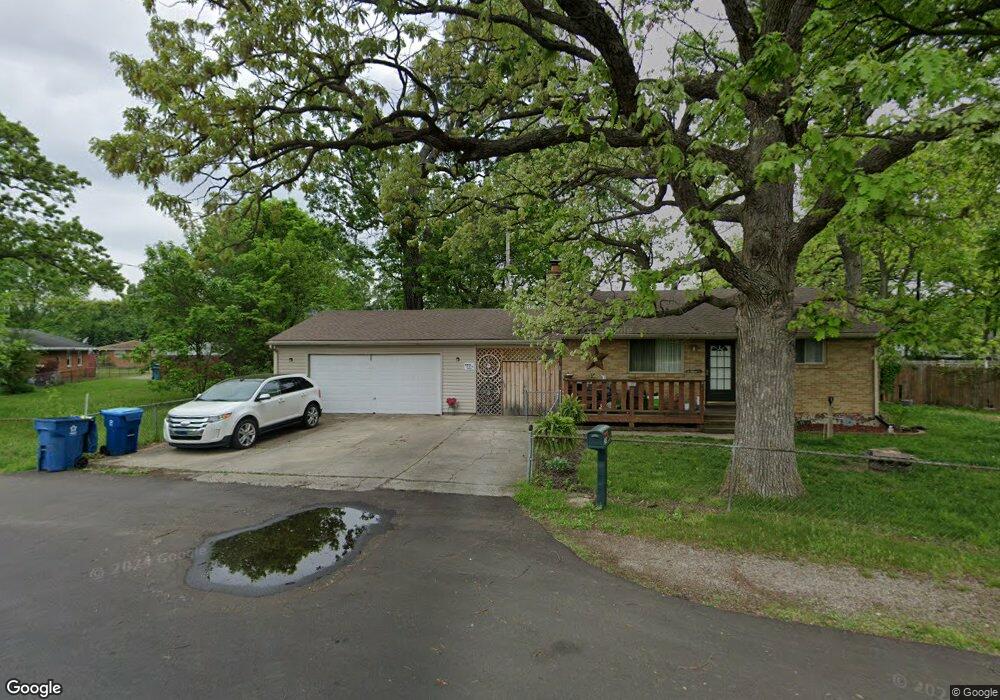
2213 Rondowa Ave Dayton, OH 45404
Avondale NeighborhoodEstimated Value: $93,000 - $138,000
2
Beds
2
Baths
832
Sq Ft
$130/Sq Ft
Est. Value
About This Home
This home is located at 2213 Rondowa Ave, Dayton, OH 45404 and is currently estimated at $108,099, approximately $129 per square foot. 2213 Rondowa Ave is a home located in Montgomery County with nearby schools including Stebbins High School, Pathway School of Discovery, and Horizon Science Academy Dayton Downtown.
Ownership History
Date
Name
Owned For
Owner Type
Purchase Details
Closed on
Aug 4, 2021
Sold by
Fulton Jimmy R
Bought by
J R Fulton Properties 3 Llc
Current Estimated Value
Purchase Details
Closed on
Oct 15, 2014
Sold by
Christiana Trust
Bought by
Fulton Jimmy R
Purchase Details
Closed on
Jun 2, 2014
Sold by
English Rebecca L
Bought by
Christiana Trust
Purchase Details
Closed on
Feb 16, 2007
Sold by
Metzner Charles E and Metzner Violet E
Bought by
English Rebecca L
Home Financials for this Owner
Home Financials are based on the most recent Mortgage that was taken out on this home.
Original Mortgage
$83,991
Interest Rate
6.27%
Mortgage Type
FHA
Purchase Details
Closed on
Jul 29, 2005
Sold by
Duman Robert E and Duman Evangelina F
Bought by
English Rebecca L and Metzner Charles E
Home Financials for this Owner
Home Financials are based on the most recent Mortgage that was taken out on this home.
Original Mortgage
$64,490
Interest Rate
5.66%
Mortgage Type
FHA
Create a Home Valuation Report for This Property
The Home Valuation Report is an in-depth analysis detailing your home's value as well as a comparison with similar homes in the area
Home Values in the Area
Average Home Value in this Area
Purchase History
| Date | Buyer | Sale Price | Title Company |
|---|---|---|---|
| J R Fulton Properties 3 Llc | -- | None Available | |
| Fulton Jimmy R | $21,000 | Partners Land Title Agency | |
| Christiana Trust | $16,000 | None Available | |
| English Rebecca L | -- | Midwest Title Company | |
| English Rebecca L | $65,000 | -- |
Source: Public Records
Mortgage History
| Date | Status | Borrower | Loan Amount |
|---|---|---|---|
| Previous Owner | English Rebecca L | $83,991 | |
| Previous Owner | English Rebecca L | $64,490 |
Source: Public Records
Tax History Compared to Growth
Tax History
| Year | Tax Paid | Tax Assessment Tax Assessment Total Assessment is a certain percentage of the fair market value that is determined by local assessors to be the total taxable value of land and additions on the property. | Land | Improvement |
|---|---|---|---|---|
| 2024 | $1,384 | $28,660 | $4,380 | $24,280 |
| 2023 | $1,384 | $28,660 | $4,380 | $24,280 |
| 2022 | $1,477 | $22,930 | $3,500 | $19,430 |
| 2021 | $1,505 | $22,930 | $3,500 | $19,430 |
| 2020 | $1,505 | $22,930 | $3,500 | $19,430 |
| 2019 | $1,698 | $23,150 | $3,150 | $20,000 |
| 2018 | $1,701 | $23,150 | $3,150 | $20,000 |
| 2017 | $1,701 | $23,150 | $3,150 | $20,000 |
| 2016 | $1,689 | $22,310 | $3,500 | $18,810 |
| 2015 | $1,664 | $22,310 | $3,500 | $18,810 |
| 2014 | $1,664 | $22,310 | $3,500 | $18,810 |
| 2012 | -- | $21,120 | $3,490 | $17,630 |
Source: Public Records
Map
Nearby Homes
- - Rondowa Ave
- -- Rondowa Ave
- 2249 Prince Albert Blvd
- 2249 Valley Pike
- 2245 Valley Pike
- 29 Barcelona Ave
- - Prince Albert Blvd
- -- Prince Albert Blvd
- 518 Tyron Ave
- 546 Wynora Ave
- 2460 Bushnell Ave
- -- Valley Pike
- - Valley Pike
- 2249 - Valley Pike
- 2301 Valley Pike
- 641 Prince Albert Blvd
- 241 Community Dr
- 1930 Brandt Pike
- 1020 Saint Adelbert Ave
- 1012 Saint Adelbert Ave
- 2215 Rondowa Ave
- 2212 Bushnell Ave
- 2214 Bushnell Ave
- 2217 Rondowa Ave
- 2208 Bushnell Ave
- 2216 Bushnell Ave
- 2205 Rondowa Ave
- 2225 Rondowa Ave
- 2220 Bushnell Ave
- 2201 Rondowa Ave
- 2222 Bushnell Ave
- 2212 Rondowa Ave
- 2207 Bushnell Ave
- 2215 Bushnell Ave
- 2217 Bushnell Ave
- 2213 Bushnell Ave
- 2231 Rondowa Ave
- 2219 Bushnell Ave
- 2249 Prince Albert Ave
- 2221 Bushnell Ave