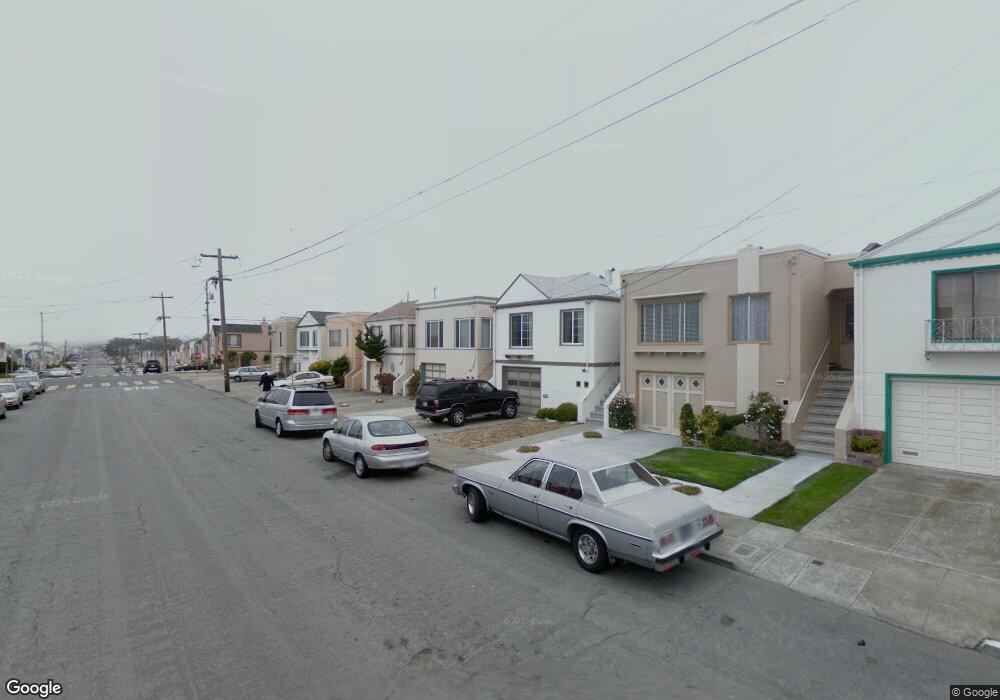
2214 41st Ave San Francisco, CA 94116
Outer Parkside NeighborhoodEstimated Value: $1,902,358 - $2,047,000
4
Beds
3
Baths
2,192
Sq Ft
$903/Sq Ft
Est. Value
About This Home
This home is located at 2214 41st Ave, San Francisco, CA 94116 and is currently estimated at $1,979,090, approximately $902 per square foot. 2214 41st Ave is a home located in San Francisco County with nearby schools including Sunset Elementary School, Giannini (A.P.) Middle School, and St. Gabriel School.
Ownership History
Date
Name
Owned For
Owner Type
Purchase Details
Closed on
Feb 15, 2025
Sold by
Chen Kevin Jin Wen and Chen Jia Jun
Bought by
Chen Kenny Yabin and Chen Jia Jun
Current Estimated Value
Purchase Details
Closed on
May 13, 2017
Sold by
Chen Kevin Jin Wen
Bought by
Chen Kevin Jin Wen and Chen Jia Jun
Purchase Details
Closed on
Oct 4, 2015
Sold by
Chen Ping Lan and Chen Kevin Jin Wen
Bought by
Chen Kevin Jin Wen
Purchase Details
Closed on
Aug 28, 2015
Sold by
Chen Sharon Hui and Chen Kevin Jin Wen
Bought by
Chen Ping Lan and Chen Kevin Jin Wen
Purchase Details
Closed on
Jul 26, 2015
Sold by
Chen Hui Juan and Chen Jin Wen
Bought by
Chen Sharon Hui and Chen Kevin Jin Wen
Purchase Details
Closed on
Nov 26, 2012
Sold by
Chen Chao Jun and Chen Ping Lan
Bought by
Chen Hui Juan and Chen Jin Wen
Purchase Details
Closed on
Aug 7, 2012
Sold by
Manzano Lolito U and Manzano Gloria O
Bought by
Chen Chao Jun and Chen Ping Lan
Create a Home Valuation Report for This Property
The Home Valuation Report is an in-depth analysis detailing your home's value as well as a comparison with similar homes in the area
Home Values in the Area
Average Home Value in this Area
Purchase History
| Date | Buyer | Sale Price | Title Company |
|---|---|---|---|
| Chen Kenny Yabin | -- | None Listed On Document | |
| Chen Kevin Jin Wen | -- | None Available | |
| Chen Kevin Jin Wen | -- | None Available | |
| Chen Ping Lan | -- | None Available | |
| Chen Sharon Hui | -- | None Available | |
| Chen Hui Juan | -- | None Available | |
| Chen Chao Jun | $685,000 | Fidelity National Title Co |
Source: Public Records
Tax History Compared to Growth
Tax History
| Year | Tax Paid | Tax Assessment Tax Assessment Total Assessment is a certain percentage of the fair market value that is determined by local assessors to be the total taxable value of land and additions on the property. | Land | Improvement |
|---|---|---|---|---|
| 2025 | $13,386 | $1,103,940 | $772,762 | $331,178 |
| 2024 | $13,386 | $1,082,297 | $757,611 | $324,686 |
| 2023 | $13,262 | $1,061,077 | $742,756 | $318,321 |
| 2022 | $13,005 | $1,040,273 | $728,193 | $312,080 |
| 2021 | $12,774 | $1,019,876 | $713,915 | $305,961 |
| 2020 | $12,888 | $1,009,420 | $706,596 | $302,824 |
| 2019 | $12,399 | $989,629 | $692,742 | $296,887 |
| 2018 | $11,981 | $970,127 | $679,091 | $291,036 |
| 2017 | $8,912 | $726,807 | $508,766 | $218,041 |
| 2016 | $8,672 | $712,552 | $498,788 | $213,764 |
| 2015 | $8,579 | $701,852 | $491,296 | $210,556 |
| 2014 | -- | $688,108 | $481,676 | $206,432 |
Source: Public Records
Map
Nearby Homes