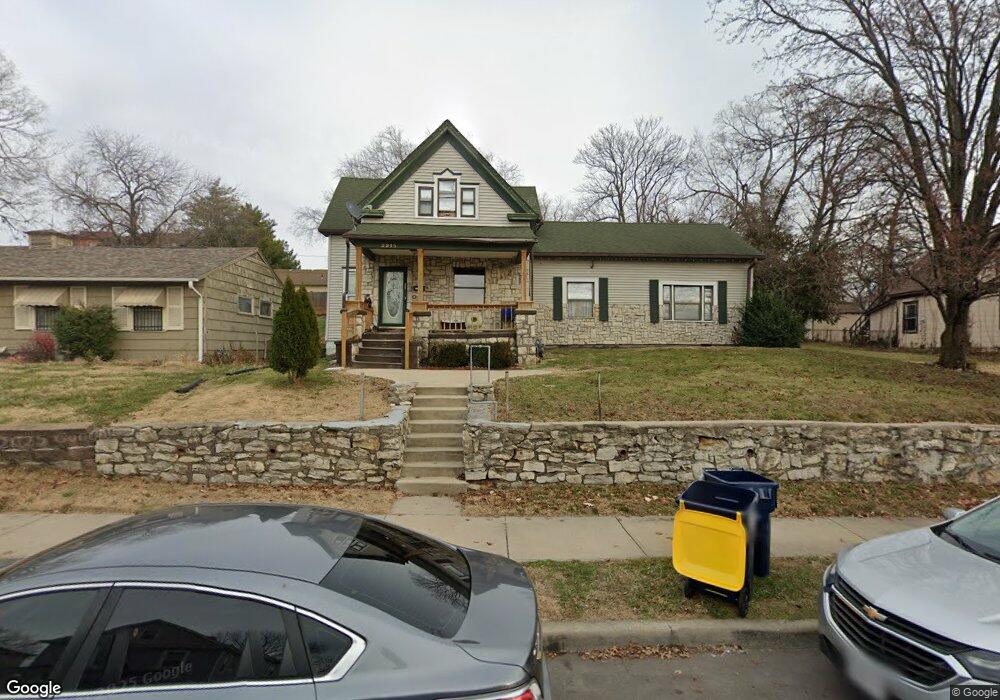
2215 Montgall Ave Kansas City, MO 64127
Washington Wheatley NeighborhoodEstimated Value: $156,984 - $202,000
4
Beds
3
Baths
2,050
Sq Ft
$90/Sq Ft
Est. Value
About This Home
This home is located at 2215 Montgall Ave, Kansas City, MO 64127 and is currently estimated at $183,746, approximately $89 per square foot. 2215 Montgall Ave is a home located in Jackson County with nearby schools including Phillis Wheatley Elementary School, Central Middle School, and East High School.
Ownership History
Date
Name
Owned For
Owner Type
Purchase Details
Closed on
Dec 2, 2011
Sold by
Camacho Patricio Perez
Bought by
Gonzalez Katty
Current Estimated Value
Purchase Details
Closed on
Jan 28, 2010
Sold by
Federal National Mortgage Association
Bought by
Perez Camacho Patricio
Purchase Details
Closed on
Oct 30, 2009
Sold by
Hammons Angela and Hammons Marlon
Bought by
Federal National Mortgage Association
Purchase Details
Closed on
Aug 21, 2000
Sold by
Hammons Marlon and Hammons Angela
Bought by
Hammons Marlon and Hammons Angela
Home Financials for this Owner
Home Financials are based on the most recent Mortgage that was taken out on this home.
Original Mortgage
$78,700
Interest Rate
8.15%
Mortgage Type
Purchase Money Mortgage
Purchase Details
Closed on
Jul 31, 1998
Sold by
Cheryl Leverette
Bought by
Hammons Marlon
Purchase Details
Closed on
Jul 1, 1997
Sold by
Cheryl Leverette
Bought by
Hammons Marlon L
Create a Home Valuation Report for This Property
The Home Valuation Report is an in-depth analysis detailing your home's value as well as a comparison with similar homes in the area
Home Values in the Area
Average Home Value in this Area
Purchase History
| Date | Buyer | Sale Price | Title Company |
|---|---|---|---|
| Gonzalez Katty | -- | None Available | |
| Perez Camacho Patricio | -- | Continental Title | |
| Federal National Mortgage Association | $126,854 | None Available | |
| Hammons Marlon | -- | Columbian National Title | |
| Hammons Marlon | -- | -- | |
| Hammons Marlon L | $650 | -- |
Source: Public Records
Mortgage History
| Date | Status | Borrower | Loan Amount |
|---|---|---|---|
| Previous Owner | Hammons Marlon | $78,700 |
Source: Public Records
Tax History Compared to Growth
Tax History
| Year | Tax Paid | Tax Assessment Tax Assessment Total Assessment is a certain percentage of the fair market value that is determined by local assessors to be the total taxable value of land and additions on the property. | Land | Improvement |
|---|---|---|---|---|
| 2025 | $1,342 | $1,984 | $1,946 | $38 |
| 2024 | $1,329 | $17,003 | $709 | $16,294 |
| 2023 | $1,329 | $17,003 | $832 | $16,171 |
| 2022 | $123 | $1,501 | $323 | $1,178 |
| 2021 | $123 | $1,501 | $323 | $1,178 |
| 2020 | $109 | $1,317 | $323 | $994 |
| 2019 | $107 | $1,317 | $323 | $994 |
| 2018 | $105 | $1,317 | $323 | $994 |
| 2017 | $105 | $1,317 | $323 | $994 |
| 2016 | $103 | $1,284 | $323 | $961 |
| 2014 | $103 | $1,284 | $323 | $961 |
Source: Public Records
Map
Nearby Homes
- 2125 Montgall Ave
- 2331 Montgall Ave
- 2416 E 22nd St
- 2028 Kansas Ave
- 2013 Kansas Ave
- 3424 E 24th Terrace
- 2111 Park Ave E
- 2006 Agnes Ave
- 3009 E 20th Terrace
- 2122 Park Ave
- 1909 Kansas Ave
- 2445 Wabash Ave
- 1834 Kansas Ave
- 1905 Kansas Ave
- 2444 Montgall Ave
- 2334 Walrond Ave
- 2540 Montgall Ave
- 3009 E 19th Terrace
- 1829 Kansas Ave
- 3301 E 20th Terrace
- 2207 Montgall Ave
- 2219 Montgall Ave
- 2223 Montgall Ave
- 2210 Montgall Ave
- 2212 Montgall Ave
- 2208 Montgall Ave
- 2214 Montgall Ave
- 2216 Montgall Ave
- 2610 E 23rd St
- 2206 Montgall Ave
- 2703 E 22nd St
- 2617 E 22nd St
- 2214 Benton Blvd
- 2615 E 22nd St
- 2611 E 22nd St
- 2200 Benton Blvd
- 2606 E 23rd St Unit A
- 2302 Montgall Ave
- 2127 Montgall Ave
- 2217 Prospect Ave