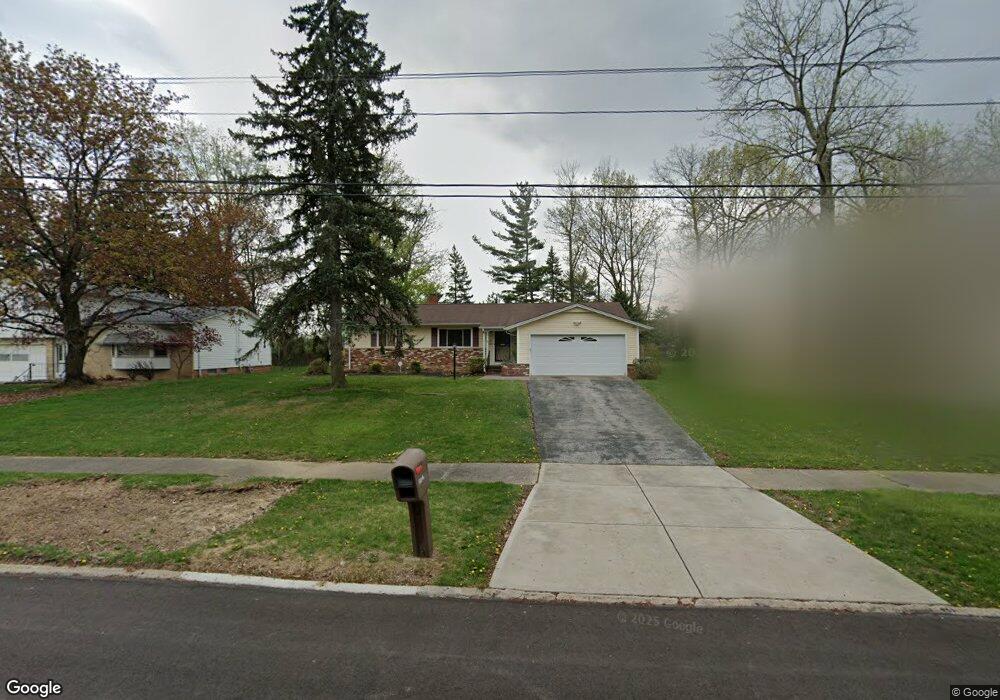
22170 Sandalwood Rd Bedford, OH 44146
Estimated Value: $162,000 - $228,000
3
Beds
2
Baths
1,428
Sq Ft
$130/Sq Ft
Est. Value
About This Home
This home is located at 22170 Sandalwood Rd, Bedford, OH 44146 and is currently estimated at $185,398, approximately $129 per square foot. 22170 Sandalwood Rd is a home located in Cuyahoga County with nearby schools including Heskett Middle School, Bedford High School, and Ohio College Preparatory School.
Ownership History
Date
Name
Owned For
Owner Type
Purchase Details
Closed on
Dec 17, 2018
Sold by
Hunter Dianna C
Bought by
Hunter Norman
Current Estimated Value
Purchase Details
Closed on
May 25, 2004
Sold by
Wilson Maurice
Bought by
Wilson Dianna C
Purchase Details
Closed on
Jun 22, 1998
Sold by
Forster Patricia Lvg Trust
Bought by
Wilson Maurice and Wilson Dianna C
Home Financials for this Owner
Home Financials are based on the most recent Mortgage that was taken out on this home.
Original Mortgage
$116,350
Interest Rate
7.02%
Mortgage Type
VA
Purchase Details
Closed on
Aug 20, 1992
Sold by
Forster Helen M
Bought by
Forster Patricia H
Purchase Details
Closed on
Nov 8, 1979
Sold by
Forster George E and Forster Helen M
Bought by
Forster Helen M
Purchase Details
Closed on
Jan 1, 1975
Bought by
Forster George E and Forster Helen M
Create a Home Valuation Report for This Property
The Home Valuation Report is an in-depth analysis detailing your home's value as well as a comparison with similar homes in the area
Home Values in the Area
Average Home Value in this Area
Purchase History
| Date | Buyer | Sale Price | Title Company |
|---|---|---|---|
| Hunter Norman | -- | None Available | |
| Wilson Dianna C | -- | -- | |
| Wilson Maurice | $114,950 | -- | |
| Forster Patricia H | -- | -- | |
| Forster Helen M | -- | -- | |
| Forster George E | -- | -- |
Source: Public Records
Mortgage History
| Date | Status | Borrower | Loan Amount |
|---|---|---|---|
| Previous Owner | Wilson Maurice | $116,350 |
Source: Public Records
Tax History Compared to Growth
Tax History
| Year | Tax Paid | Tax Assessment Tax Assessment Total Assessment is a certain percentage of the fair market value that is determined by local assessors to be the total taxable value of land and additions on the property. | Land | Improvement |
|---|---|---|---|---|
| 2024 | $3,692 | $51,800 | $11,235 | $40,565 |
| 2023 | $3,947 | $47,920 | $8,470 | $39,450 |
| 2022 | $3,450 | $47,915 | $8,470 | $39,445 |
| 2021 | $3,413 | $47,920 | $8,470 | $39,450 |
| 2020 | $3,110 | $39,270 | $6,930 | $32,340 |
| 2019 | $3,019 | $112,200 | $19,800 | $92,400 |
| 2018 | $3,149 | $39,270 | $6,930 | $32,340 |
| 2017 | $3,325 | $41,090 | $8,750 | $32,340 |
| 2016 | $3,298 | $41,090 | $8,750 | $32,340 |
| 2015 | $3,292 | $41,090 | $8,750 | $32,340 |
| 2014 | $3,292 | $41,090 | $8,750 | $32,340 |
Source: Public Records
Map
Nearby Homes
- 5301 Mardale Ave
- 20750 Bowling Green Rd
- 5285 Mardale Ave
- 20739 Donny Brook Rd
- 20732 Applegate Rd
- 5385 Bartlett Rd
- 21416 Gardenview Dr
- 179 Willard Ave
- 20625 Centuryway Rd
- 20814 Kenyon Dr
- 20701 Kenyon Dr
- 63 Willard Ave
- 54 Willard Ave
- 21207 Franklin Rd
- 61 Hubbell Way
- 66 Hubbell Way
- 58 Hubbell Way
- 62 Hubbell Way
- 54 Hubbell Way
- 57 Hubbell Way
- 22140 Sandalwood Rd
- 22200 Sandalwood Rd
- 22110 Sandalwood Rd
- 22230 Sandalwood Rd
- 5427 Holly Rd
- 22080 Sandalwood Rd
- 22260 Sandalwood Rd
- 5428 Mardale Ave
- 5419 Holly Rd
- 5420 Mardale Ave
- 22290 Sandalwood Rd
- 22050 Sandalwood Rd
- 5411 Holly Rd
- 5412 Mardale Ave
- 5428 Holly Rd
- 22020 Sandalwood Rd
- 22320 Sandalwood Rd
- 5420 Holly Rd
- 5403 Holly Rd
- 5404 Mardale Ave