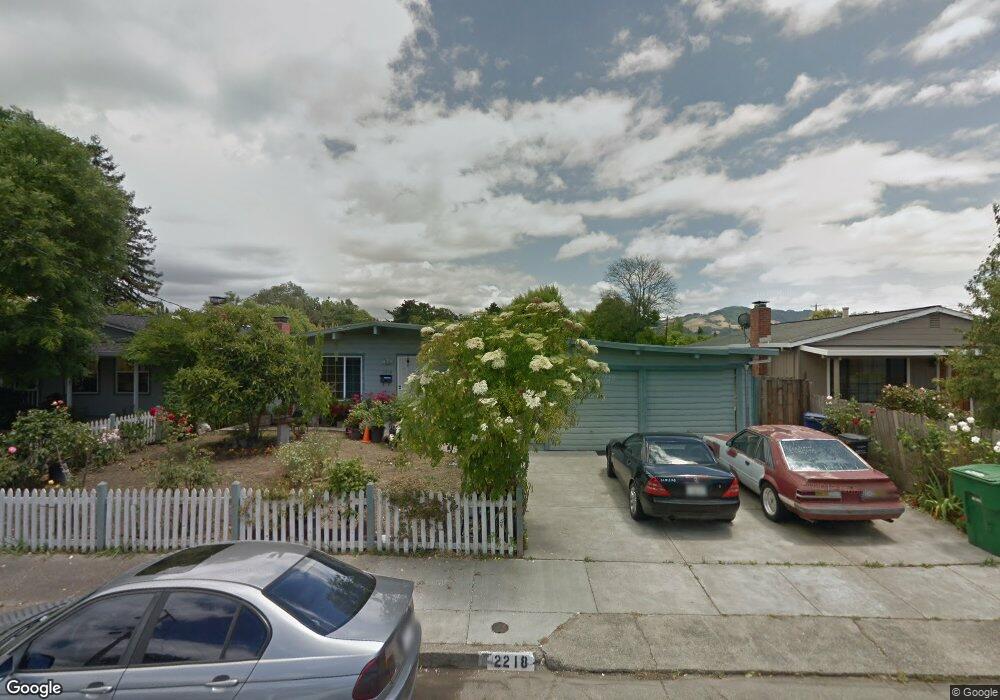
2218 Westwood Dr Santa Rosa, CA 95407
Estimated Value: $532,000 - $580,629
3
Beds
1
Bath
1,080
Sq Ft
$518/Sq Ft
Est. Value
About This Home
This home is located at 2218 Westwood Dr, Santa Rosa, CA 95407 and is currently estimated at $559,157, approximately $517 per square foot. 2218 Westwood Dr is a home located in Sonoma County with nearby schools including Elsie Allen High School and St. Michael's Orthodox School.
Ownership History
Date
Name
Owned For
Owner Type
Purchase Details
Closed on
Apr 18, 2001
Sold by
Garcia Elizabeth and Rivas Elia
Bought by
Garcia Alfredo and Garcia Elizabeth
Current Estimated Value
Home Financials for this Owner
Home Financials are based on the most recent Mortgage that was taken out on this home.
Original Mortgage
$195,000
Outstanding Balance
$71,670
Interest Rate
6.98%
Estimated Equity
$487,487
Purchase Details
Closed on
May 26, 1998
Sold by
Garcia Alfredo
Bought by
Rivas Elizabeth
Home Financials for this Owner
Home Financials are based on the most recent Mortgage that was taken out on this home.
Original Mortgage
$146,450
Interest Rate
7.13%
Mortgage Type
FHA
Purchase Details
Closed on
May 14, 1998
Sold by
Brodsky Gregory L and Brodsky Sandra L
Bought by
Rivas Elizabeth and Rivas Elia
Home Financials for this Owner
Home Financials are based on the most recent Mortgage that was taken out on this home.
Original Mortgage
$146,450
Interest Rate
7.13%
Mortgage Type
FHA
Create a Home Valuation Report for This Property
The Home Valuation Report is an in-depth analysis detailing your home's value as well as a comparison with similar homes in the area
Home Values in the Area
Average Home Value in this Area
Purchase History
| Date | Buyer | Sale Price | Title Company |
|---|---|---|---|
| Garcia Alfredo | $130,000 | Chicago Title Co | |
| Rivas Elizabeth | -- | Fidelity National Title Co | |
| Rivas Elia | -- | Fidelity National Title Co | |
| Rivas Elizabeth | $149,000 | Fidelity National Title Co |
Source: Public Records
Mortgage History
| Date | Status | Borrower | Loan Amount |
|---|---|---|---|
| Open | Garcia Alfredo | $195,000 | |
| Closed | Rivas Elizabeth | $146,450 |
Source: Public Records
Tax History Compared to Growth
Tax History
| Year | Tax Paid | Tax Assessment Tax Assessment Total Assessment is a certain percentage of the fair market value that is determined by local assessors to be the total taxable value of land and additions on the property. | Land | Improvement |
|---|---|---|---|---|
| 2025 | $4,110 | $237,891 | $95,792 | $142,099 |
| 2024 | $4,110 | $233,227 | $93,914 | $139,313 |
| 2023 | $4,110 | $228,655 | $92,073 | $136,582 |
| 2022 | $3,597 | $224,172 | $90,268 | $133,904 |
| 2021 | $3,728 | $219,778 | $88,499 | $131,279 |
| 2020 | $9,751 | $217,525 | $87,592 | $129,933 |
| 2019 | $3,434 | $213,261 | $85,875 | $127,386 |
| 2018 | $3,522 | $209,081 | $84,192 | $124,889 |
| 2017 | $3,402 | $204,983 | $82,542 | $122,441 |
| 2016 | $3,250 | $200,965 | $80,924 | $120,041 |
| 2015 | $3,143 | $197,947 | $79,709 | $118,238 |
| 2014 | $3,042 | $194,070 | $78,148 | $115,922 |
Source: Public Records
Map
Nearby Homes
- 1260 Aloise Ave
- 2632 Wild Bill Way
- 1630 Mathwig Dr
- 2721 Victoria Dr
- 2727 Victoria Dr
- 444 Pueblo Bonito Place
- 0 West Ave Unit 325019616
- 2630 Arrowhead Dr
- 1953 Alamo Ln
- 1461 Trombetta St
- 2599 Silver Spur Dr
- 487 Hearn Ave
- 2154 Corby Ave
- 2002 Marble St
- 1911 Corby Ave
- 1447 Beachwood Dr
- 2488 Giffen Ave
- 1521 Hughes Ave
- 2863 Liscum St
- 2542 Buss Dr
- 2216 Westwood Dr
- 2220 Westwood Dr
- 2208 Westwood Dr
- 2222 Westwood Dr
- 1535 Hearn Ave
- 1605 Hearn Ave
- 2219 Westwood Dr
- 2223 Westwood Dr
- 1532 Gloria Dr
- 1617 Hearn Ave
- 1526 Gloria Dr
- 1629 Hearn Ave
- 1525 Hearn Ave
- 2209 Westwood Dr
- 1520 Gloria Dr
- 1635 Hearn Ave
- 1606 Gloria Dr
- 1519 Hearn Ave
- 1514 Gloria Dr
- 1645 Hearn Ave