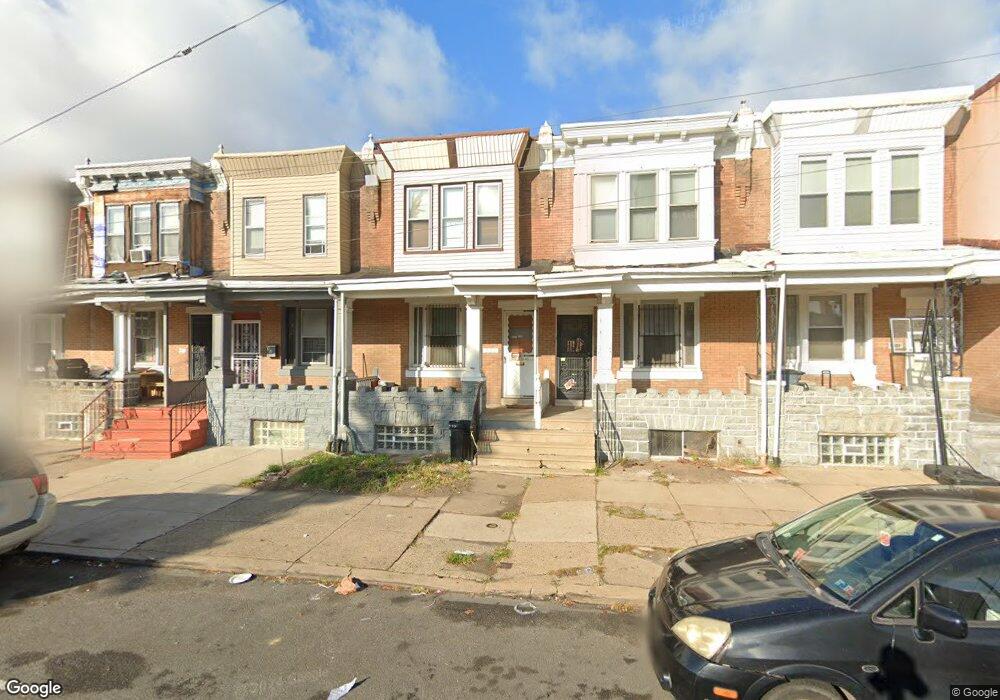
222 N 57th St Philadelphia, PA 19139
Haddington NeighborhoodEstimated Value: $110,000 - $161,000
3
Beds
1
Bath
1,150
Sq Ft
$118/Sq Ft
Est. Value
About This Home
This home is located at 222 N 57th St, Philadelphia, PA 19139 and is currently estimated at $135,980, approximately $118 per square foot. 222 N 57th St is a home located in Philadelphia County with nearby schools including John Barry Elementary School, William L. Sayre High School, and Universal Bluford Charter School.
Ownership History
Date
Name
Owned For
Owner Type
Purchase Details
Closed on
Oct 12, 2020
Sold by
Hutchins Mary E
Bought by
Hutchins Tiana C
Current Estimated Value
Purchase Details
Closed on
Oct 8, 2020
Sold by
Bradshaw Margaret and Bradshaw Clemina
Bought by
Bradshaw Clemina and Bradsuaw Davina
Purchase Details
Closed on
Jul 11, 2019
Sold by
Hutchins Mary E and The Estate Of Benny Robert Hut
Bought by
Hutchins Mary E
Purchase Details
Closed on
Nov 14, 1985
Bought by
Hutchins Benny R
Create a Home Valuation Report for This Property
The Home Valuation Report is an in-depth analysis detailing your home's value as well as a comparison with similar homes in the area
Home Values in the Area
Average Home Value in this Area
Purchase History
| Date | Buyer | Sale Price | Title Company |
|---|---|---|---|
| Hutchins Tiana C | -- | None Available | |
| Bradshaw Clemina | -- | None Available | |
| Hutchins Mary E | -- | None Available | |
| Hutchins Benny R | $15,000 | -- |
Source: Public Records
Tax History Compared to Growth
Tax History
| Year | Tax Paid | Tax Assessment Tax Assessment Total Assessment is a certain percentage of the fair market value that is determined by local assessors to be the total taxable value of land and additions on the property. | Land | Improvement |
|---|---|---|---|---|
| 2025 | $1,078 | $110,300 | $22,060 | $88,240 |
| 2024 | $1,078 | $110,300 | $22,060 | $88,240 |
| 2023 | $1,078 | $77,000 | $15,400 | $61,600 |
| 2022 | $448 | $32,000 | $15,400 | $16,600 |
| 2021 | $883 | $0 | $0 | $0 |
| 2020 | $883 | $0 | $0 | $0 |
| 2019 | $851 | $0 | $0 | $0 |
| 2018 | $819 | $0 | $0 | $0 |
| 2017 | $819 | $0 | $0 | $0 |
| 2016 | $341 | $0 | $0 | $0 |
| 2015 | $466 | $0 | $0 | $0 |
| 2014 | -- | $34,800 | $4,746 | $30,054 |
| 2012 | -- | $4,960 | $1,395 | $3,565 |
Source: Public Records
Map
Nearby Homes