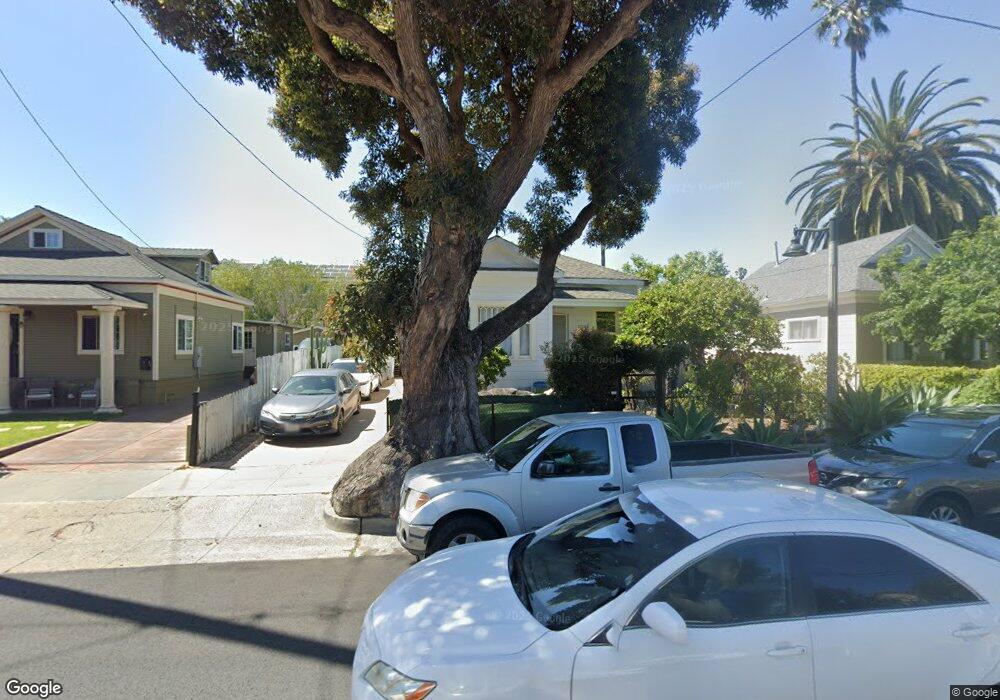
222 W Haley St Santa Barbara, CA 93101
Estimated Value: $1,186,649 - $1,350,000
3
Beds
1
Bath
1,186
Sq Ft
$1,079/Sq Ft
Est. Value
About This Home
This home is located at 222 W Haley St, Santa Barbara, CA 93101 and is currently estimated at $1,279,412, approximately $1,078 per square foot. 222 W Haley St is a home located in Santa Barbara County with nearby schools including La Cumbre Junior High School, San Marcos Senior High School, and Notre Dame School.
Ownership History
Date
Name
Owned For
Owner Type
Purchase Details
Closed on
Jan 25, 2016
Sold by
Borrayo Jose Luis
Bought by
Borrayo Jose Luis and Borrayo Jesus
Current Estimated Value
Home Financials for this Owner
Home Financials are based on the most recent Mortgage that was taken out on this home.
Original Mortgage
$98,000
Outstanding Balance
$78,098
Interest Rate
3.94%
Mortgage Type
New Conventional
Estimated Equity
$1,201,314
Purchase Details
Closed on
Jul 22, 2003
Sold by
Borrayo Jose Luis and Borrayo Emma
Bought by
Borrayo Jose Luis
Home Financials for this Owner
Home Financials are based on the most recent Mortgage that was taken out on this home.
Original Mortgage
$150,000
Interest Rate
5.15%
Mortgage Type
Credit Line Revolving
Purchase Details
Closed on
Aug 3, 1994
Sold by
Borrayo Fernando and Rodriguez Salvador
Bought by
Borrayo Jose Luis and Borrayo Ema
Create a Home Valuation Report for This Property
The Home Valuation Report is an in-depth analysis detailing your home's value as well as a comparison with similar homes in the area
Home Values in the Area
Average Home Value in this Area
Purchase History
| Date | Buyer | Sale Price | Title Company |
|---|---|---|---|
| Borrayo Jose Luis | -- | Wfg National Title Ins Co | |
| Borrayo Jose Luis | -- | Stewart Title Of Ca Inc | |
| Borrayo Jose Luis | -- | -- |
Source: Public Records
Mortgage History
| Date | Status | Borrower | Loan Amount |
|---|---|---|---|
| Open | Borrayo Jose Luis | $98,000 | |
| Closed | Borrayo Jose Luis | $150,000 | |
| Closed | Borrayo Jose Luis | $139,000 |
Source: Public Records
Tax History Compared to Growth
Tax History
| Year | Tax Paid | Tax Assessment Tax Assessment Total Assessment is a certain percentage of the fair market value that is determined by local assessors to be the total taxable value of land and additions on the property. | Land | Improvement |
|---|---|---|---|---|
| 2025 | $3,039 | $288,920 | $169,955 | $118,965 |
| 2023 | $3,039 | $277,703 | $163,356 | $114,347 |
| 2022 | $2,932 | $272,258 | $160,153 | $112,105 |
| 2021 | $2,863 | $266,920 | $157,013 | $109,907 |
| 2020 | $2,833 | $264,185 | $155,404 | $108,781 |
| 2019 | $2,784 | $259,006 | $152,357 | $106,649 |
| 2018 | $2,744 | $253,928 | $149,370 | $104,558 |
| 2017 | $2,653 | $248,950 | $146,442 | $102,508 |
| 2016 | $2,669 | $244,070 | $143,571 | $100,499 |
| 2015 | $2,640 | $240,405 | $141,415 | $98,990 |
| 2014 | $2,598 | $235,696 | $138,645 | $97,051 |
Source: Public Records
Map
Nearby Homes
- 517 Brinkerhoff Ave
- 519 Brinkerhoff Ave
- 401 Chapala St Unit 214
- 401 Chapala St Unit 111
- 415 W Gutierrez St Unit 11
- 712 Castillo St
- 105 W De la Guerra St Unit S
- 124 W Yanonali St
- 134 Chapala
- 618 Anacapa St Unit 5
- 521 W Montecito St Unit 4
- 111 Chapala St
- 330 W Canon Perdido St
- 325 Ladera St Unit 5
- 324 W Cabrillo Blvd
- 218 Santa Barbara St Unit D
- 220 Santa Barbara St Unit C
- 1035 De la Vina St
- 912 San Andres St
- 136 W Figueroa St
- 216 W Haley St
- 228 W Haley St
- 214 W Haley St
- 211 W Haley St
- 208 W Haley St
- 215 W Haley St
- 231 W Haley St Unit A
- 213 W Haley St
- 524 Bath St Unit 2
- 524 Bath St Unit 1
- 524 Bath St Unit 12
- 209 W Haley St
- 435 De la Vina St
- 519 De la Vina St
- 431 De la Vina St
- 526 Bath St
- 521 De la Vina St
- 435 Bath St
- 429 De la Vina St
- 424 Bath St