22209 Fox Glenn Trace Unit Tr Panama City Beach, FL 32413
Estimated Value: $1,660,000 - $1,969,081
6
Beds
7
Baths
4,629
Sq Ft
$394/Sq Ft
Est. Value
About This Home
This home is located at 22209 Fox Glenn Trace Unit Tr, Panama City Beach, FL 32413 and is currently estimated at $1,825,770, approximately $394 per square foot. 22209 Fox Glenn Trace Unit Tr is a home located in Bay County with nearby schools including Surfside Middle School, J.R. Arnold High School, and West Bay Elementary School.
Ownership History
Date
Name
Owned For
Owner Type
Purchase Details
Closed on
Mar 18, 2022
Sold by
Ullman Ramona G and Ullman Terry M
Bought by
Timothy J Capps Living Trust
Current Estimated Value
Purchase Details
Closed on
Jan 6, 2022
Sold by
Jason P Oakes Revocable Trust
Bought by
Ullmann Terry M and Ullmann Ramona G
Purchase Details
Closed on
Dec 1, 2011
Sold by
Oakes Jason P
Bought by
Oakes Jason P
Purchase Details
Closed on
Nov 29, 2011
Sold by
Gaspard Tracy Rudder and Oakes Tracy R
Bought by
Oakes Jason P
Purchase Details
Closed on
Aug 19, 2005
Sold by
Davidenko Construction Inc
Bought by
Oakes Jason P and Oakes Tracy R
Purchase Details
Closed on
Feb 26, 2002
Sold by
Lake Powell Llc
Bought by
Davidenko Construction Inc
Home Financials for this Owner
Home Financials are based on the most recent Mortgage that was taken out on this home.
Original Mortgage
$167,200
Interest Rate
6.81%
Create a Home Valuation Report for This Property
The Home Valuation Report is an in-depth analysis detailing your home's value as well as a comparison with similar homes in the area
Home Values in the Area
Average Home Value in this Area
Purchase History
| Date | Buyer | Sale Price | Title Company |
|---|---|---|---|
| Timothy J Capps Living Trust | $1,600,000 | South Oak Title | |
| Ullmann Terry M | -- | None Listed On Document | |
| Oakes Jason P | -- | Attorney | |
| Oakes Jason P | -- | Attorney | |
| Oakes Jason P | $1,371,000 | Coastal Title Assurance Llc | |
| Davidenko Construction Inc | $199,900 | -- |
Source: Public Records
Mortgage History
| Date | Status | Borrower | Loan Amount |
|---|---|---|---|
| Previous Owner | Davidenko Construction Inc | $167,200 |
Source: Public Records
Tax History Compared to Growth
Tax History
| Year | Tax Paid | Tax Assessment Tax Assessment Total Assessment is a certain percentage of the fair market value that is determined by local assessors to be the total taxable value of land and additions on the property. | Land | Improvement |
|---|---|---|---|---|
| 2024 | $19,617 | $1,474,055 | -- | -- |
| 2023 | $19,617 | $1,340,050 | $180,852 | $1,159,198 |
| 2022 | $13,605 | $940,716 | $0 | $0 |
| 2021 | $12,518 | $855,196 | $58,969 | $796,227 |
| 2020 | $11,598 | $787,534 | $36,656 | $750,878 |
| 2019 | $8,018 | $487,000 | $43,860 | $443,140 |
| 2018 | $8,480 | $552,575 | $0 | $0 |
| 2017 | $9,072 | $570,319 | $0 | $0 |
| 2016 | $9,645 | $570,453 | $0 | $0 |
| 2015 | $9,821 | $566,505 | $0 | $0 |
| 2014 | $9,997 | $571,618 | $0 | $0 |
Source: Public Records
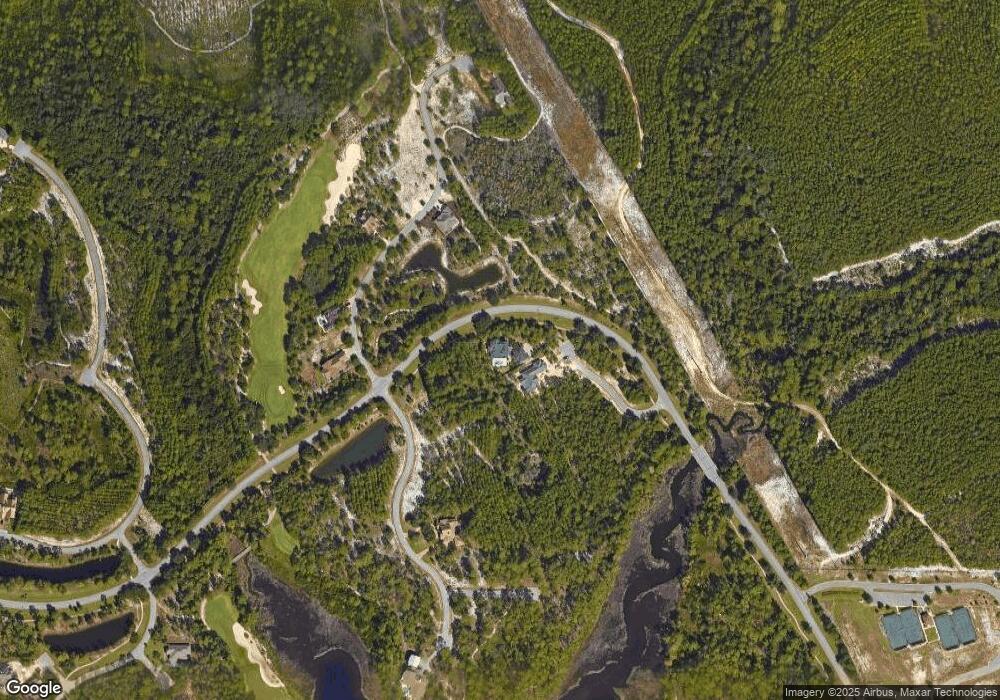
Map
Nearby Homes
- 22207 Fox Glenn Trace
- 1509 Marsh Point Ln
- 1518 Sweet Bay Trail
- 1609 Dayflower Dr
- 1408 Courtside Dr Unit 601
- 22103 Marsh Rabbit Run
- 22114 Marsh Rabbit Run
- 1401 Turtleback Trail
- 1512 Match Point Ln Unit 201
- 1503 Match Point Ln Unit 502
- 1501 Match Point Ln Unit 501
- 1508 Match Point Ln Unit 302
- 1508 Match Point 302 Ln Unit 302
- 1576 Salamander Trail
- 1405 Salamander Trail Unit 1405
- 1522 Salamander Trail
- 1118 E Water Oak Bend
- 1119 E Water Oak Bend
- 1117 E Water Oak Bend
- 1115 E Water Oak Bend
- 22209 Fox Glenn Trace
- 22209 Fox Glenn Trace Unit Trace
- 22207 Fox Glenn Trace Unit Trace
- 22207 Fox Glen Trace
- 22205 Fox Glen Unit Tr
- 22205 Fox Glenn Trail
- 22205 Fox Glen Tr
- 22205 Fox Glenn Trace
- 22203 Fox Glenn Trace
- 22205 Fox Glenn Trace Unit Tr
- 22201 Fox Glenn Trace
- 22205 Fox Glenn Trace Unit Trace
- 1512 Marsh Point Ln
- 1620 Meadow Lark Way
- 1618 Meadow Lark Way
- 1624 Meadow Lark Way
- 1617 Meadow Lark Way
- 1601 Meadow Lark Way
- 1623 Meadow Lark Way
- 1619 Meadow Lark Way