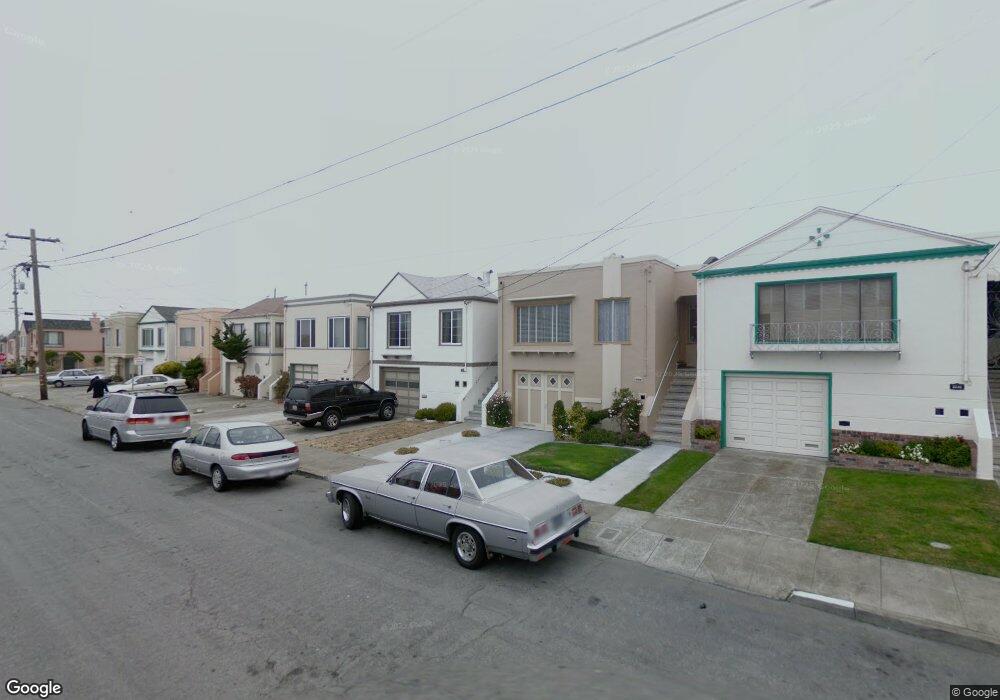
2222 41st Ave San Francisco, CA 94116
Outer Parkside NeighborhoodEstimated Value: $1,166,000 - $1,502,000
2
Beds
1
Bath
900
Sq Ft
$1,441/Sq Ft
Est. Value
About This Home
This home is located at 2222 41st Ave, San Francisco, CA 94116 and is currently estimated at $1,296,699, approximately $1,440 per square foot. 2222 41st Ave is a home located in San Francisco County with nearby schools including Sunset Elementary School, Giannini (A.P.) Middle School, and St. Gabriel School.
Ownership History
Date
Name
Owned For
Owner Type
Purchase Details
Closed on
Feb 1, 2023
Sold by
Davis Agnes E
Bought by
Davis Sarah
Current Estimated Value
Purchase Details
Closed on
Apr 15, 2013
Sold by
Davis Sarah and Lynch Frank
Bought by
Davis Sarah and Lynch Frank
Home Financials for this Owner
Home Financials are based on the most recent Mortgage that was taken out on this home.
Original Mortgage
$614,000
Interest Rate
3.87%
Mortgage Type
FHA
Purchase Details
Closed on
Apr 12, 2013
Sold by
Bushner Arlene M
Bought by
Davis Sarah and Lynch Frank
Home Financials for this Owner
Home Financials are based on the most recent Mortgage that was taken out on this home.
Original Mortgage
$614,000
Interest Rate
3.87%
Mortgage Type
FHA
Purchase Details
Closed on
Mar 19, 1999
Sold by
Ponzini Emily J
Bought by
Ponzini Emily J
Create a Home Valuation Report for This Property
The Home Valuation Report is an in-depth analysis detailing your home's value as well as a comparison with similar homes in the area
Home Values in the Area
Average Home Value in this Area
Purchase History
| Date | Buyer | Sale Price | Title Company |
|---|---|---|---|
| Davis Sarah | -- | -- | |
| Davis Agnes E | -- | -- | |
| Davis Sarah | -- | Fidelity National Title Co | |
| Davis Sarah | $690,000 | Fidelity National Title Co | |
| Davis Sarah | -- | Fidelity National Title Co | |
| Ponzini Emily J | -- | -- |
Source: Public Records
Mortgage History
| Date | Status | Borrower | Loan Amount |
|---|---|---|---|
| Previous Owner | Davis Sarah | $614,000 |
Source: Public Records
Tax History Compared to Growth
Tax History
| Year | Tax Paid | Tax Assessment Tax Assessment Total Assessment is a certain percentage of the fair market value that is determined by local assessors to be the total taxable value of land and additions on the property. | Land | Improvement |
|---|---|---|---|---|
| 2025 | $10,465 | $849,665 | $594,769 | $254,896 |
| 2024 | $10,465 | $833,005 | $583,107 | $249,898 |
| 2023 | $10,301 | $816,672 | $571,674 | $244,998 |
| 2022 | $10,178 | $800,662 | $560,466 | $240,196 |
| 2021 | $9,996 | $784,966 | $549,478 | $235,488 |
| 2020 | $10,101 | $776,918 | $543,844 | $233,074 |
| 2019 | $9,709 | $761,686 | $533,182 | $228,504 |
| 2018 | $9,383 | $746,752 | $522,728 | $224,024 |
| 2017 | $8,974 | $732,112 | $512,480 | $219,632 |
| 2016 | $8,816 | $717,758 | $502,432 | $215,326 |
| 2015 | $8,706 | $706,978 | $494,886 | $212,092 |
| 2014 | $8,478 | $693,130 | $485,192 | $207,938 |
Source: Public Records
Map
Nearby Homes