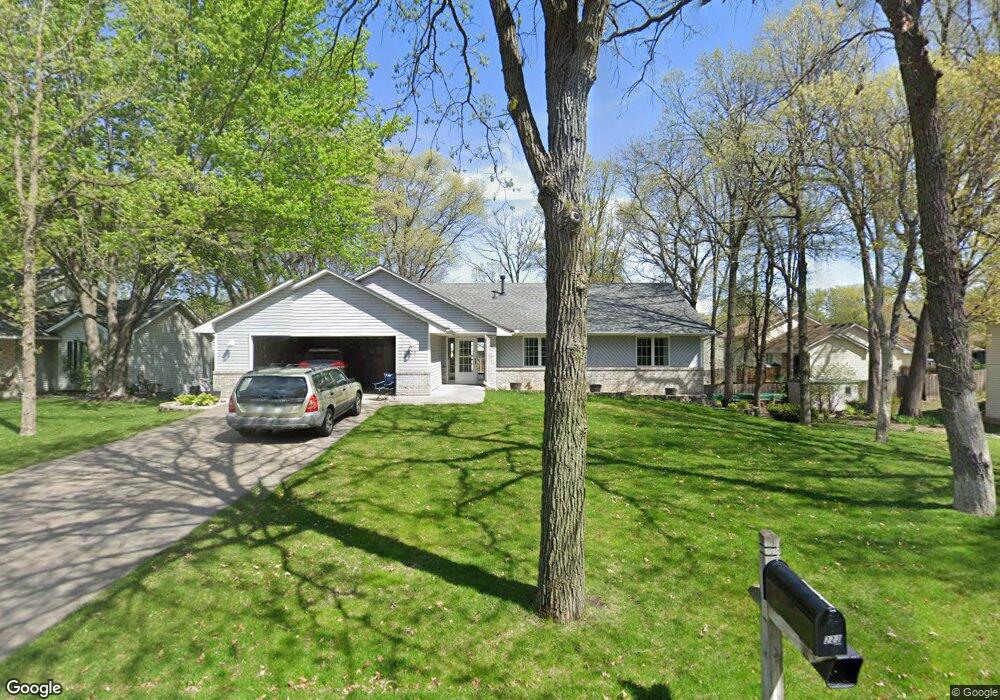
2223 129th Ln NW Coon Rapids, MN 55448
Estimated Value: $448,000 - $480,000
4
Beds
3
Baths
2,618
Sq Ft
$177/Sq Ft
Est. Value
About This Home
This home is located at 2223 129th Ln NW, Coon Rapids, MN 55448 and is currently estimated at $463,195, approximately $176 per square foot. 2223 129th Ln NW is a home located in Anoka County with nearby schools including Lucile Bruner Elementary School, Morris Bye Elementary School, and Laughlin Junior/Senior High School.
Ownership History
Date
Name
Owned For
Owner Type
Purchase Details
Closed on
Feb 25, 2022
Sold by
Marrs Christopher and Spratt Kristine
Bought by
Ryan Jordan
Current Estimated Value
Home Financials for this Owner
Home Financials are based on the most recent Mortgage that was taken out on this home.
Original Mortgage
$441,350
Outstanding Balance
$410,606
Interest Rate
3.55%
Mortgage Type
New Conventional
Estimated Equity
$52,589
Purchase Details
Closed on
Oct 4, 2021
Sold by
Ogrady Synthia
Bought by
Marrs Christopher R and Spratt Kristine
Home Financials for this Owner
Home Financials are based on the most recent Mortgage that was taken out on this home.
Original Mortgage
$262,500
Interest Rate
2.8%
Mortgage Type
New Conventional
Purchase Details
Closed on
Apr 17, 2007
Sold by
Klint Daniel A and Grady Synthia O
Bought by
Klint Daniel A and Grady Synthia O
Create a Home Valuation Report for This Property
The Home Valuation Report is an in-depth analysis detailing your home's value as well as a comparison with similar homes in the area
Home Values in the Area
Average Home Value in this Area
Purchase History
| Date | Buyer | Sale Price | Title Company |
|---|---|---|---|
| Ryan Jordan | $465,000 | -- | |
| Marrs Christopher R | $350,000 | Edina Realty Title Inc | |
| Klint Daniel A | -- | None Available |
Source: Public Records
Mortgage History
| Date | Status | Borrower | Loan Amount |
|---|---|---|---|
| Open | Ryan Jordan | $441,350 | |
| Previous Owner | Marrs Christopher R | $262,500 |
Source: Public Records
Tax History Compared to Growth
Tax History
| Year | Tax Paid | Tax Assessment Tax Assessment Total Assessment is a certain percentage of the fair market value that is determined by local assessors to be the total taxable value of land and additions on the property. | Land | Improvement |
|---|---|---|---|---|
| 2025 | $4,951 | $443,800 | $90,000 | $353,800 |
| 2024 | $4,951 | $433,300 | $87,000 | $346,300 |
| 2023 | $4,097 | $428,600 | $72,000 | $356,600 |
| 2022 | $3,519 | $391,600 | $72,000 | $319,600 |
| 2021 | $3,430 | $318,900 | $56,000 | $262,900 |
| 2020 | $3,345 | $304,400 | $56,000 | $248,400 |
| 2019 | $3,187 | $285,700 | $56,000 | $229,700 |
| 2018 | $2,983 | $265,600 | $0 | $0 |
| 2017 | $2,724 | $242,800 | $0 | $0 |
| 2016 | $2,778 | $219,400 | $0 | $0 |
| 2015 | $2,712 | $219,400 | $50,000 | $169,400 |
| 2014 | -- | $186,300 | $35,400 | $150,900 |
Source: Public Records
Map
Nearby Homes
- 12760 Raven St NW
- 12888 Nightingale St NW
- 1930 127th Cir NW
- 2147 125th Ln NW
- 13416 Swallow St NW
- 13182 Zion St NW
- 2675 128th Ave NW
- 12759 Ibis St NW
- 2068 124th Ln NW
- 1776 133rd Ave NW
- 2740 132nd Ln NW
- 1687 131st Ln NW
- 13519 Partridge Cir NW
- 12554 Grouse St NW
- 12365 Jay St NW
- 1520 129th Ave NW
- 1593 126th Ln NW
- 13182 Crane St NW
- 2270 137th Ln NW
- 1450 126th Ln NW
- 2237 129th Ln NW
- 12944 Raven St NW
- 12964 Raven St NW
- 2220 130th Ave NW
- 2251 129th Ln NW
- 2234 130th Ave NW
- 2220 129th Ln NW
- 12984 Raven St NW
- 2234 129th Ln NW
- 2248 130th Ave NW
- 2246 129th Ln NW
- 2265 129th Ln NW
- 12928 Raven St NW
- 2260 130th Ave NW
- 2258 129th Ln NW
- 12955 Raven St NW
- 2277 129th Ln NW
- 12965 Raven St NW
- 12945 Raven St NW
- 12935 Raven St NW