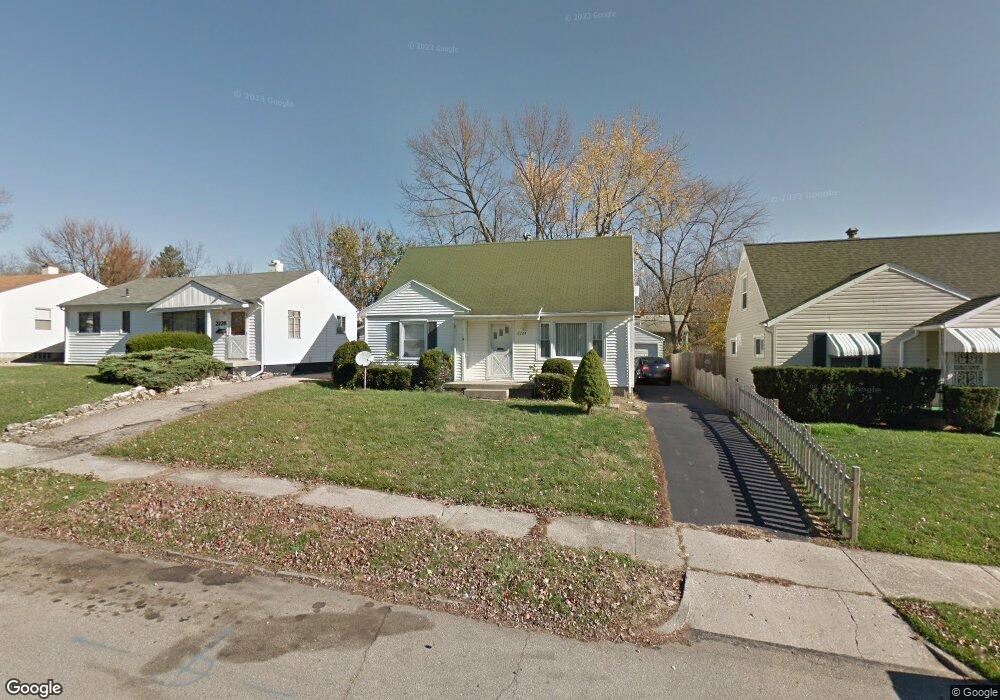
2224 Chamberlin Ave Dayton, OH 45406
Fort McKinley NeighborhoodEstimated Value: $63,000 - $78,335
3
Beds
1
Bath
996
Sq Ft
$73/Sq Ft
Est. Value
About This Home
This home is located at 2224 Chamberlin Ave, Dayton, OH 45406 and is currently estimated at $73,084, approximately $73 per square foot. 2224 Chamberlin Ave is a home located in Montgomery County with nearby schools including Valerie Elementary School, Imagine Klepinger Road Community School, and North Dayton School of Science & Discovery.
Ownership History
Date
Name
Owned For
Owner Type
Purchase Details
Closed on
Mar 11, 2025
Sold by
Harrison Douglas L and Harrison Robin R
Bought by
Campbell Tara S
Current Estimated Value
Home Financials for this Owner
Home Financials are based on the most recent Mortgage that was taken out on this home.
Original Mortgage
$59,740
Outstanding Balance
$59,420
Interest Rate
6.63%
Mortgage Type
New Conventional
Estimated Equity
$13,664
Purchase Details
Closed on
Nov 7, 2024
Sold by
Hfc Trust and Harrison Douglas L
Bought by
Harrison Douglas L and Harrison Robin R
Purchase Details
Closed on
Aug 1, 2017
Sold by
Harrison Douglas L and Harrison Robin R
Bought by
Harrison Douglas L and Harrison Robin R
Purchase Details
Closed on
Nov 5, 2014
Sold by
Harrison Douglas
Bought by
Harrison Douglas L
Purchase Details
Closed on
Apr 3, 1998
Sold by
Cochran Joyce E
Bought by
Harrison Douglas
Purchase Details
Closed on
Apr 1, 1998
Sold by
Cochran Joyce E
Bought by
Harrison Douglas H
Create a Home Valuation Report for This Property
The Home Valuation Report is an in-depth analysis detailing your home's value as well as a comparison with similar homes in the area
Home Values in the Area
Average Home Value in this Area
Purchase History
| Date | Buyer | Sale Price | Title Company |
|---|---|---|---|
| Campbell Tara S | $58,000 | Chicago Title | |
| Harrison Douglas L | -- | None Listed On Document | |
| Harrison Douglas L | -- | None Available | |
| Harrison Douglas L | -- | None Available | |
| Harrison Douglas | $28,500 | -- | |
| Harrison Douglas H | $28,500 | -- |
Source: Public Records
Mortgage History
| Date | Status | Borrower | Loan Amount |
|---|---|---|---|
| Open | Campbell Tara S | $59,740 |
Source: Public Records
Tax History Compared to Growth
Tax History
| Year | Tax Paid | Tax Assessment Tax Assessment Total Assessment is a certain percentage of the fair market value that is determined by local assessors to be the total taxable value of land and additions on the property. | Land | Improvement |
|---|---|---|---|---|
| 2024 | $1,072 | $14,260 | $3,070 | $11,190 |
| 2023 | $1,072 | $14,260 | $3,070 | $11,190 |
| 2022 | $1,121 | $10,970 | $2,360 | $8,610 |
| 2021 | $1,116 | $10,970 | $2,360 | $8,610 |
| 2020 | $1,114 | $10,970 | $2,360 | $8,610 |
| 2019 | $1,226 | $10,850 | $2,130 | $8,720 |
| 2018 | $1,227 | $10,850 | $2,130 | $8,720 |
| 2017 | $1,220 | $10,850 | $2,130 | $8,720 |
| 2016 | $1,414 | $12,150 | $2,360 | $9,790 |
| 2015 | $1,248 | $12,270 | $2,360 | $9,910 |
| 2014 | $1,248 | $12,270 | $2,360 | $9,910 |
| 2012 | -- | $11,420 | $3,360 | $8,060 |
Source: Public Records
Map
Nearby Homes
- 2212 Chamberlin Ave
- 2417 Wheeler Ave
- 3748 Saint James Ave
- 3593 Saint James Ave
- 2145 Kipling Dr
- 2620 N Gettysburg Ave
- 2127 Kensington Dr
- 2200 Kensington Dr
- 2150 Kensington Dr
- 2726 Wentworth Ave
- 3801 Salem Ave
- 4445 Prescott Ave
- 3740 Kings Hwy
- 1954 Kensington Dr
- Lot#25 Glenbrook Dr
- Lot#24 Glenbrook Dr
- Lot#1 Glenbrook Dr
- Lot#21 Glenbrook Dr
- 3738 Kings Hwy
- 1910 Kensington Dr
- 2228 Chamberlin Ave
- 2220 Chamberlin Ave
- 2232 Chamberlin Ave
- 2216 Chamberlin Ave
- 2229 Fairport Ave
- 2215 Fairport Ave
- 2236 Chamberlin Ave
- 2237 Fairport Ave
- 2219 Chamberlin Ave
- 2227 Chamberlin Ave
- 2233 Chamberlin Ave
- 2208 Chamberlin Ave
- 2213 Chamberlin Ave
- 2237 Chamberlin Ave
- 3732 W Hillcrest Ave
- 3728 W Hillcrest Ave
- 3724 W Hillcrest Ave
- 2204 Chamberlin Ave
- 2209 Chamberlin Ave
- 2205 Fairport Ave