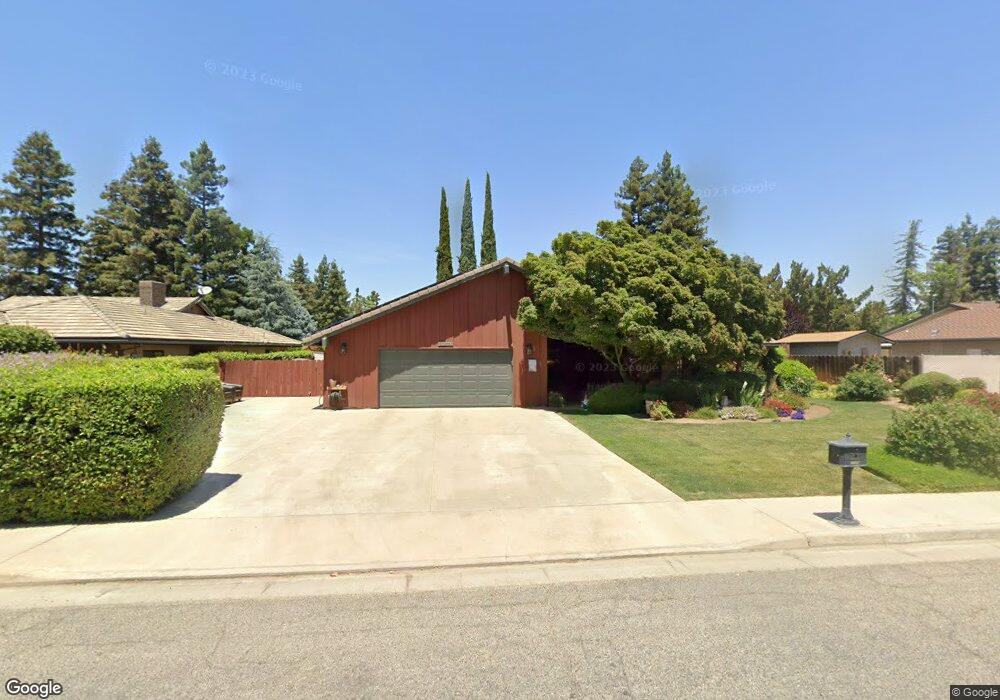
22274 W Harrison Ave Porterville, CA 93257
Porterville Northwest NeighborhoodEstimated Value: $513,139 - $567,000
4
Beds
3
Baths
3,297
Sq Ft
$161/Sq Ft
Est. Value
About This Home
This home is located at 22274 W Harrison Ave, Porterville, CA 93257 and is currently estimated at $529,785, approximately $160 per square foot. 22274 W Harrison Ave is a home located in Tulare County with nearby schools including William R. Buckley Elementary School, Burton Middle School, and Monache High School.
Ownership History
Date
Name
Owned For
Owner Type
Purchase Details
Closed on
Nov 13, 2020
Sold by
Stucker Larry R and Stucker Paula I
Bought by
Stucker Larry R and Stucker Paula I
Current Estimated Value
Home Financials for this Owner
Home Financials are based on the most recent Mortgage that was taken out on this home.
Original Mortgage
$201,000
Outstanding Balance
$162,186
Interest Rate
2.8%
Mortgage Type
New Conventional
Estimated Equity
$367,599
Purchase Details
Closed on
Jan 3, 2018
Sold by
Rogers Janet K
Bought by
Stucker Larry R and Stucker Paula L
Home Financials for this Owner
Home Financials are based on the most recent Mortgage that was taken out on this home.
Original Mortgage
$200,000
Interest Rate
4.45%
Mortgage Type
New Conventional
Purchase Details
Closed on
Nov 21, 2017
Sold by
Rogers Janet K and Rogers Reginald Irving
Bought by
Rogers Janet K
Home Financials for this Owner
Home Financials are based on the most recent Mortgage that was taken out on this home.
Original Mortgage
$200,000
Interest Rate
4.45%
Mortgage Type
New Conventional
Create a Home Valuation Report for This Property
The Home Valuation Report is an in-depth analysis detailing your home's value as well as a comparison with similar homes in the area
Home Values in the Area
Average Home Value in this Area
Purchase History
| Date | Buyer | Sale Price | Title Company |
|---|---|---|---|
| Stucker Larry R | -- | Amrock Llc | |
| Stucker Larry R | -- | Amrock Inc | |
| Stucker Larry R | $365,000 | Chicago Title Co | |
| Rogers Janet K | -- | Chicago Title Co |
Source: Public Records
Mortgage History
| Date | Status | Borrower | Loan Amount |
|---|---|---|---|
| Open | Stucker Larry R | $201,000 | |
| Previous Owner | Stucker Larry R | $200,000 |
Source: Public Records
Tax History Compared to Growth
Tax History
| Year | Tax Paid | Tax Assessment Tax Assessment Total Assessment is a certain percentage of the fair market value that is determined by local assessors to be the total taxable value of land and additions on the property. | Land | Improvement |
|---|---|---|---|---|
| 2025 | $4,288 | $415,305 | $62,580 | $352,725 |
| 2024 | $4,288 | $407,162 | $61,353 | $345,809 |
| 2023 | $4,298 | $399,179 | $60,150 | $339,029 |
| 2022 | $4,131 | $391,353 | $58,971 | $332,382 |
| 2021 | $4,067 | $383,680 | $57,815 | $325,865 |
| 2020 | $3,991 | $379,746 | $57,222 | $322,524 |
| 2019 | $3,988 | $372,300 | $56,100 | $316,200 |
| 2018 | $2,042 | $198,900 | $27,864 | $171,036 |
| 2017 | $2,008 | $195,000 | $27,318 | $167,682 |
| 2016 | $2,004 | $191,176 | $26,782 | $164,394 |
| 2015 | $1,841 | $188,305 | $26,380 | $161,925 |
| 2014 | $1,841 | $184,616 | $25,863 | $158,753 |
Source: Public Records
Map
Nearby Homes
- 575 N Brandy Way
- 2300 W Morton Ave Unit 163
- 2300 W Morton Ave Unit 22
- 2300 W Morton Ave Unit 135
- 15247 Road 223
- 2070 W Harrison Ave
- 313 Balmoral Dr
- 2179 W Della Ave
- 100 S Westwood St Unit 52
- 100 S Westwood St Unit 1
- 100 S Westwood St Unit 17
- 100 S Westwood St
- 100 S Westwood St Unit Lot 105
- 100 S Westwood St Unit 110
- 100 S Westwood St Unit Lot 71
- 100 S Westwood St Unit 128
- 100 S Westwood St Unit 92
- 100 S Westwood St Unit 20
- 249 S Westwood St
- Sydney Plan at Laurelwood
- 22250 W Harrison Ave
- 22286 W Harrison Ave
- 401 Colby Place
- 410 Colby Place
- 22298 W Harrison Ave
- 22238 W Harrison Ave
- 22275 W Harrison Ave
- 415 Colby Place
- 22251 W Harrison Ave
- 22287 W Harrison Ave
- 412 N Kanai Dr
- 420 Colby Place
- 422 N Kanai Dr
- 22239 W Harrison Ave
- 22299 W Harrison Ave
- 22310 W Harrison Ave
- 425 Colby Place
- 22226 W Harrison Ave
- 403 N Ryan Terrace
- 413 N Ryan Terrace