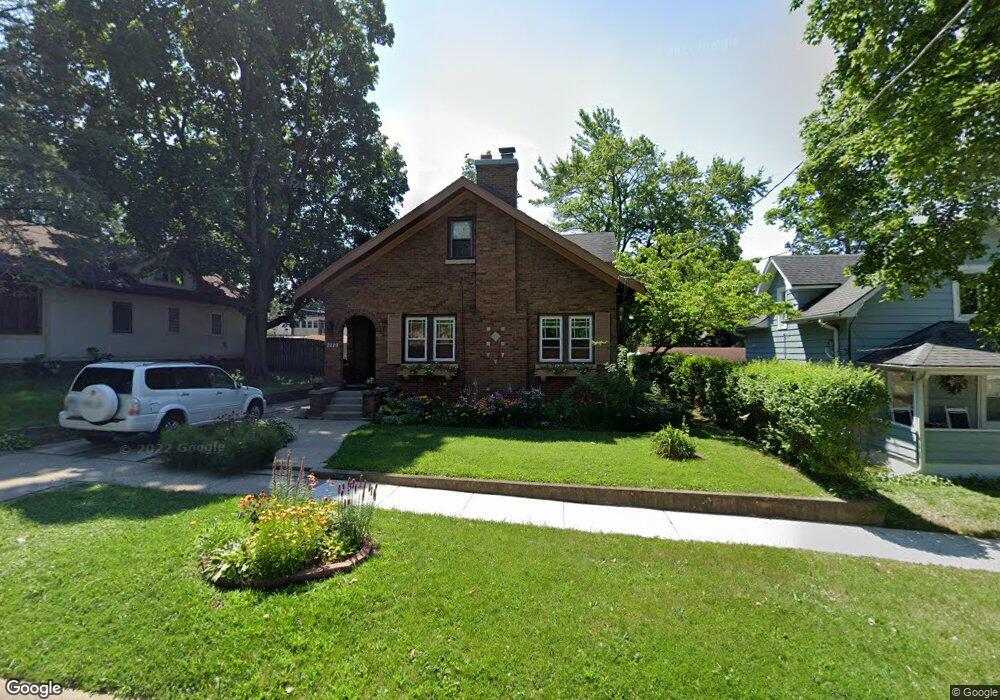
2229 13th Ave Rockford, IL 61104
Keith Creek NeighborhoodEstimated Value: $149,080 - $179,000
4
Beds
2
Baths
1,944
Sq Ft
$87/Sq Ft
Est. Value
About This Home
This home is located at 2229 13th Ave, Rockford, IL 61104 and is currently estimated at $168,520, approximately $86 per square foot. 2229 13th Ave is a home located in Winnebago County with nearby schools including Constance Lane Elementary School, Abraham Lincoln Middle School, and Rockford East High School.
Ownership History
Date
Name
Owned For
Owner Type
Purchase Details
Closed on
Dec 17, 2024
Sold by
Clyde R Tucker Trust and Tucker Clyde R
Bought by
Tucker Clyde R and Tucker Ericka M
Current Estimated Value
Purchase Details
Closed on
Mar 26, 2019
Sold by
Brad Carlyle and Brad Crystal
Bought by
Tucker Clyde R Trust
Purchase Details
Closed on
Feb 6, 2019
Sold by
Brad Carlyle and Brad Crystal
Bought by
Tucker Clyde R Trust
Purchase Details
Closed on
Jun 16, 2008
Bought by
Tucker Clyde and Tucker Erica
Create a Home Valuation Report for This Property
The Home Valuation Report is an in-depth analysis detailing your home's value as well as a comparison with similar homes in the area
Home Values in the Area
Average Home Value in this Area
Purchase History
| Date | Buyer | Sale Price | Title Company |
|---|---|---|---|
| Tucker Clyde R | -- | None Listed On Document | |
| Tucker Clyde R Trust | -- | Title Underwriters Agency | |
| Tucker Clyde R Trust | -- | Title Underwriters Agency | |
| Clyde R Tucker Trust | -- | Lambert J Laird | |
| Tucker Clyde | $120,000 | -- |
Source: Public Records
Tax History Compared to Growth
Tax History
| Year | Tax Paid | Tax Assessment Tax Assessment Total Assessment is a certain percentage of the fair market value that is determined by local assessors to be the total taxable value of land and additions on the property. | Land | Improvement |
|---|---|---|---|---|
| 2024 | $2,712 | $34,620 | $5,331 | $29,289 |
| 2023 | $2,547 | $30,527 | $4,701 | $25,826 |
| 2022 | $2,432 | $27,286 | $4,202 | $23,084 |
| 2021 | $2,331 | $25,019 | $3,853 | $21,166 |
| 2020 | $2,270 | $23,651 | $3,642 | $20,009 |
| 2019 | $2,216 | $22,542 | $3,471 | $19,071 |
| 2018 | $2,402 | $22,975 | $3,272 | $19,703 |
| 2017 | $2,372 | $21,987 | $3,131 | $18,856 |
| 2016 | $2,353 | $21,575 | $3,072 | $18,503 |
| 2015 | $2,382 | $21,575 | $3,072 | $18,503 |
| 2014 | $3,058 | $23,346 | $3,849 | $19,497 |
Source: Public Records
Map
Nearby Homes