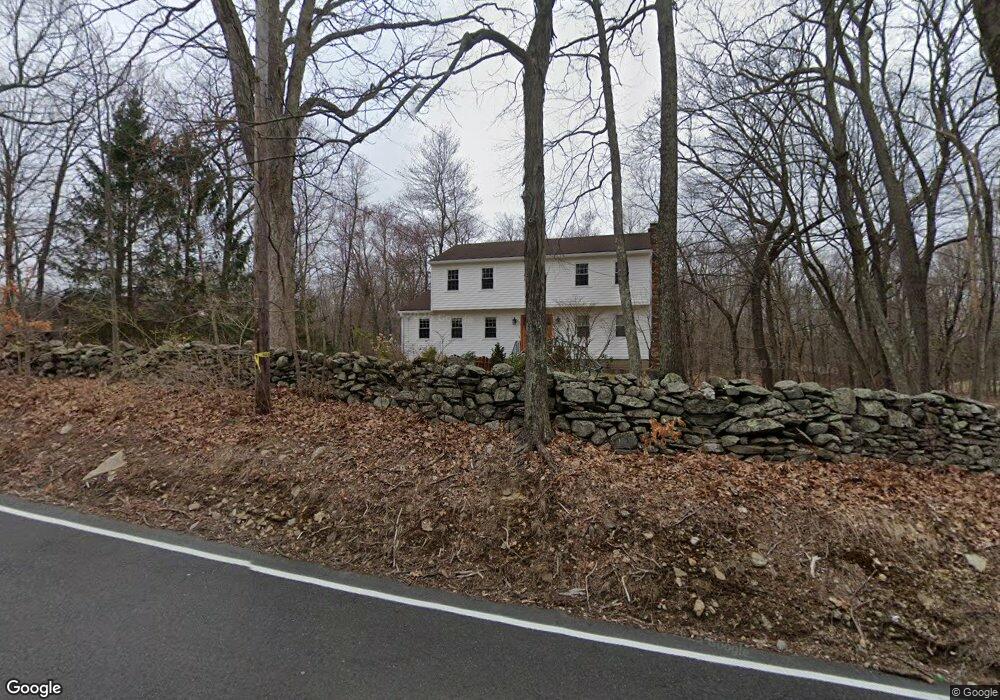
223 Old Newtown Rd Monroe, CT 06468
Estimated Value: $600,000 - $676,385
4
Beds
3
Baths
2,118
Sq Ft
$304/Sq Ft
Est. Value
About This Home
This home is located at 223 Old Newtown Rd, Monroe, CT 06468 and is currently estimated at $643,846, approximately $303 per square foot. 223 Old Newtown Rd is a home located in Fairfield County with nearby schools including Stepney Elementary School, Jockey Hollow Middle School, and Masuk High School.
Ownership History
Date
Name
Owned For
Owner Type
Purchase Details
Closed on
Aug 28, 2009
Sold by
Lackshier John
Bought by
Kirchner Jeanne M and Kehoe Matthew J
Current Estimated Value
Home Financials for this Owner
Home Financials are based on the most recent Mortgage that was taken out on this home.
Original Mortgage
$306,000
Interest Rate
5.17%
Purchase Details
Closed on
Apr 27, 2009
Sold by
Alieva Fatima
Bought by
Lockshier John
Purchase Details
Closed on
Mar 17, 2009
Sold by
Carris Christopher M
Bought by
Alieva Fatima
Purchase Details
Closed on
Sep 18, 2002
Sold by
Kratky John S and Kratky Maryann
Bought by
Carris Christopher M and Carris Suzanne M
Purchase Details
Closed on
May 15, 1987
Sold by
Tims Willie
Bought by
Kratky John
Create a Home Valuation Report for This Property
The Home Valuation Report is an in-depth analysis detailing your home's value as well as a comparison with similar homes in the area
Home Values in the Area
Average Home Value in this Area
Purchase History
| Date | Buyer | Sale Price | Title Company |
|---|---|---|---|
| Kirchner Jeanne M | $382,500 | -- | |
| Kirchner Jeanne M | $382,500 | -- | |
| Lockshier John | $250,000 | -- | |
| Lockshier John | $250,000 | -- | |
| Alieva Fatima | $240,000 | -- | |
| Alieva Fatima | $240,000 | -- | |
| Carris Christopher M | $260,000 | -- | |
| Carris Christopher M | $260,000 | -- | |
| Kratky John | $281,000 | -- |
Source: Public Records
Mortgage History
| Date | Status | Borrower | Loan Amount |
|---|---|---|---|
| Open | Kratky John | $250,000 | |
| Closed | Kratky John | $306,000 |
Source: Public Records
Tax History Compared to Growth
Tax History
| Year | Tax Paid | Tax Assessment Tax Assessment Total Assessment is a certain percentage of the fair market value that is determined by local assessors to be the total taxable value of land and additions on the property. | Land | Improvement |
|---|---|---|---|---|
| 2025 | $10,415 | $363,270 | $105,070 | $258,200 |
| 2024 | $9,613 | $251,200 | $88,300 | $162,900 |
| 2023 | $9,433 | $251,200 | $88,300 | $162,900 |
| 2022 | $9,259 | $251,200 | $88,300 | $162,900 |
| 2021 | $9,134 | $251,200 | $88,300 | $162,900 |
| 2020 | $8,913 | $251,200 | $88,300 | $162,900 |
| 2019 | $8,493 | $238,700 | $91,100 | $147,600 |
| 2018 | $11,041 | $238,700 | $91,100 | $147,600 |
| 2017 | $10,876 | $238,700 | $91,100 | $147,600 |
| 2016 | $8,355 | $238,700 | $91,100 | $147,600 |
| 2015 | $8,199 | $238,700 | $91,100 | $147,600 |
| 2014 | $8,060 | $259,910 | $115,570 | $144,340 |
Source: Public Records
Map
Nearby Homes
- 2 Great Oak Farm Rd Unit 2
- 34 Easton Rd
- 77 Bart Rd
- 33 Patmar Dr
- 549 Cutler's Farm Rd
- 26 Edgehill Cir
- 14 Little Diet Rd
- 91 Harvester Rd
- 80 Woodlawn Rd
- 41 Alpine Rd
- 13 Shadowwood Cir
- 67 Hidden Knolls Cir
- 161 Jockey Hollow Rd
- 108 Wells Rd
- 107 Hidden Knolls Cir Unit 107
- 52 Autumn Dr
- 13 School St
- 6 Crossbow Ln
- 37 Kitcher Ct
- 5288 Madison Ave
- 215 Old Newtown Rd
- 216 Old Newtown Rd
- 216 Old Newtown Rd Unit Road
- 10 Oak Ridge Rd
- 228 Old Newtown Rd
- 15 Oak Ridge Rd
- 205 Old Newtown Rd
- 233 Old Newtown Rd
- 197 Old Newtown Rd
- 21 Oak Ridge Rd
- 240 Old Newtown Rd
- 28 Oak Ridge Rd
- 243 Old Newtown Rd
- 25 Oak Ridge Rd
- 251 Old Newtown Rd
- 29 Oak Ridge Rd
- 27 Oak Ridge Rd
- 250 Old Newtown Rd
- 92 Pepper St
- 35 Oak Ridge Rd