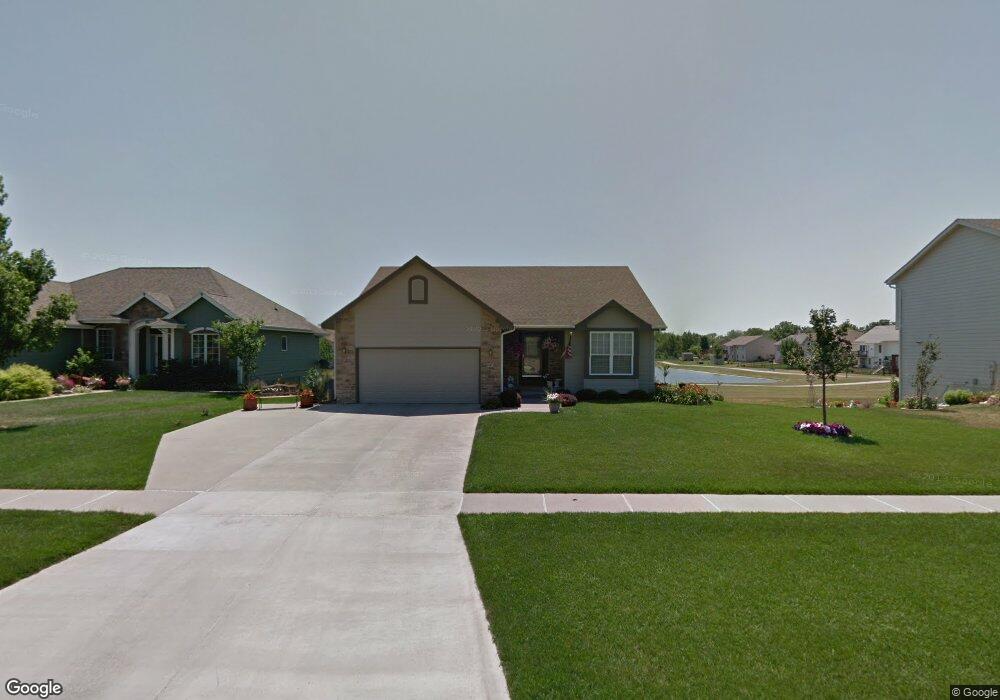
223 SE 33rd St Ankeny, IA 50021
Southeast Ankeny NeighborhoodEstimated payment $2,441/month
Highlights
- Ranch Style House
- 1 Fireplace
- 4-minute walk to Springwood Park
- Southview Middle School Rated A
- No HOA
About This Home
This home is located at 223 SE 33rd St, Ankeny, IA 50021 and is currently priced at $389,900, approximately $296 per square foot. This property was built in 2002. 223 SE 33rd St is a home located in Polk County with nearby schools including Southview Middle School, Parkview Middle School, and Ankeny High School.
Home Details
Home Type
- Single Family
Est. Annual Taxes
- $4,808
Year Built
- Built in 2002
Lot Details
- 10,250 Sq Ft Lot
- Lot Dimensions are 82x125
Home Design
- Ranch Style House
Interior Spaces
- 1,315 Sq Ft Home
- 1 Fireplace
Community Details
- No Home Owners Association
Listing and Financial Details
- Assessor Parcel Number 18100626095032
Map
Home Values in the Area
Average Home Value in this Area
Tax History
| Year | Tax Paid | Tax Assessment Tax Assessment Total Assessment is a certain percentage of the fair market value that is determined by local assessors to be the total taxable value of land and additions on the property. | Land | Improvement |
|---|---|---|---|---|
| 2025 | $4,808 | $335,900 | $66,700 | $269,200 |
| 2024 | $4,808 | $308,100 | $59,900 | $248,200 |
| 2023 | $5,260 | $308,100 | $59,900 | $248,200 |
| 2022 | $5,202 | $266,000 | $50,600 | $215,400 |
| 2021 | $5,208 | $266,000 | $50,600 | $215,400 |
| 2020 | $5,138 | $251,500 | $47,800 | $203,700 |
| 2019 | $4,996 | $251,500 | $47,800 | $203,700 |
| 2018 | $4,980 | $233,600 | $43,000 | $190,600 |
| 2017 | $4,582 | $233,600 | $43,000 | $190,600 |
| 2016 | $4,576 | $203,900 | $34,200 | $169,700 |
| 2015 | $4,576 | $203,900 | $34,200 | $169,700 |
| 2014 | $4,238 | $189,800 | $31,500 | $158,300 |
Property History
| Date | Event | Price | List to Sale | Price per Sq Ft |
|---|---|---|---|---|
| 10/31/2025 10/31/25 | Price Changed | $389,900 | +2.7% | $297 / Sq Ft |
| 10/31/2025 10/31/25 | Pending | -- | -- | -- |
| 10/30/2025 10/30/25 | For Sale | $379,500 | -- | $289 / Sq Ft |
Purchase History
| Date | Type | Sale Price | Title Company |
|---|---|---|---|
| Quit Claim Deed | -- | None Listed On Document | |
| Warranty Deed | $213,000 | -- | |
| Warranty Deed | $182,000 | -- | |
| Corporate Deed | $37,000 | -- |
Mortgage History
| Date | Status | Loan Amount | Loan Type |
|---|---|---|---|
| Previous Owner | $80,000 | Fannie Mae Freddie Mac | |
| Previous Owner | $173,100 | No Value Available | |
| Previous Owner | $140,000 | Construction |
Source: Des Moines Area Association of REALTORS®
MLS Number: 729578
APN: 181-00626095032
Disclaimer: Certain information contained herein is derived from information provided by parties other than Homes.com. All information provided is deemed reliable, but is not guaranteed to be accurate and should be independently verified.
![]() IDX information is provided exclusively for personal, non-commercial use, and may not be used for any purpose other than to identify prospective properties consumers may be interested in purchasing. Information is deemed reliable but not guaranteed.
IDX information is provided exclusively for personal, non-commercial use, and may not be used for any purpose other than to identify prospective properties consumers may be interested in purchasing. Information is deemed reliable but not guaranteed.
- 3207 SE Turnberry Dr
- 3206 SE Turnberry Dr
- 3009 SE Turnberry Dr
- 3010 SE Turnberry Dr
- 126 SW 36th Ln
- 3905 SE 30th St
- 3805 SE 30th St
- 3904 SE 30th St
- 3909 SE 30th St
- 3908 SE 30th St
- 3902 SE 30th St
- 4003 SE 30th St
- 4005 SE 30th St
- 4001 SE 30th St
- 3801 SE 30th St
- 407 SW Springfield Dr
- 3013 SE Magnolia Dr
- 213 SW Carriage Dr
- 514 SE Marigold Ct
- 207 Murffys Run Ct
