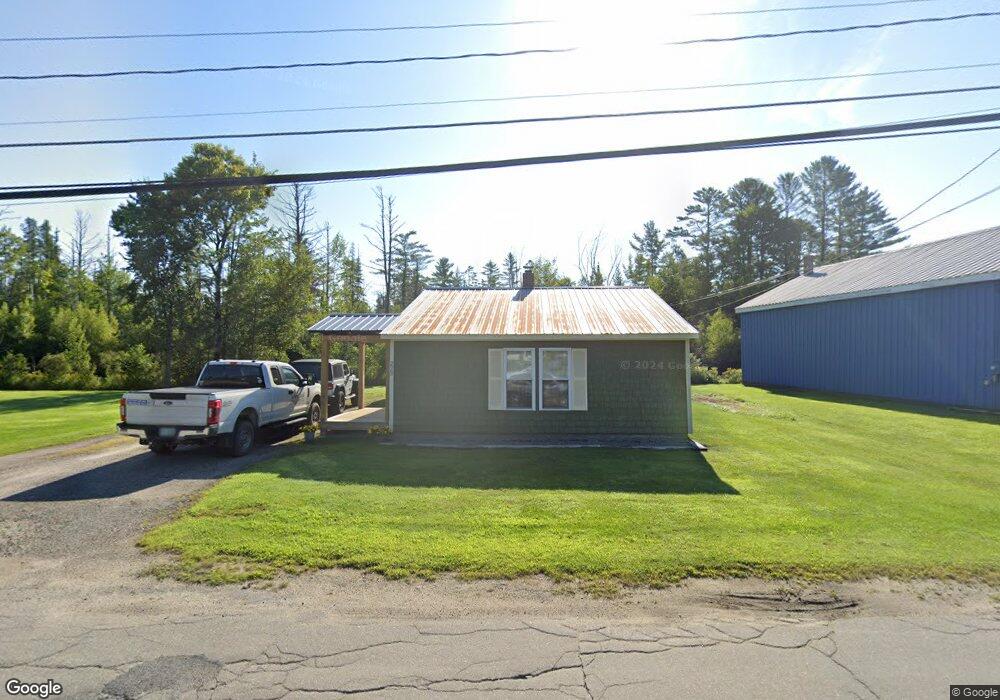
223 Summer St Lancaster, NH 03584
Estimated Value: $114,000 - $195,000
2
Beds
1
Bath
1,080
Sq Ft
$136/Sq Ft
Est. Value
About This Home
This home is located at 223 Summer St, Lancaster, NH 03584 and is currently estimated at $146,622, approximately $135 per square foot. 223 Summer St is a home located in Coos County with nearby schools including Lancaster Elementary School, White Mountains Regional High School, and North Country Charter Academy Lancaster (M).
Ownership History
Date
Name
Owned For
Owner Type
Purchase Details
Closed on
Jul 29, 2005
Sold by
Rexford David A and Rexford Linda T
Bought by
Bishop Jusin A
Current Estimated Value
Home Financials for this Owner
Home Financials are based on the most recent Mortgage that was taken out on this home.
Original Mortgage
$59,430
Interest Rate
5.67%
Mortgage Type
Purchase Money Mortgage
Create a Home Valuation Report for This Property
The Home Valuation Report is an in-depth analysis detailing your home's value as well as a comparison with similar homes in the area
Home Values in the Area
Average Home Value in this Area
Purchase History
| Date | Buyer | Sale Price | Title Company |
|---|---|---|---|
| Bishop Jusin A | $59,900 | -- |
Source: Public Records
Mortgage History
| Date | Status | Borrower | Loan Amount |
|---|---|---|---|
| Open | Bishop Jusin A | $71,050 | |
| Closed | Bishop Jusin A | $59,430 |
Source: Public Records
Tax History Compared to Growth
Tax History
| Year | Tax Paid | Tax Assessment Tax Assessment Total Assessment is a certain percentage of the fair market value that is determined by local assessors to be the total taxable value of land and additions on the property. | Land | Improvement |
|---|---|---|---|---|
| 2024 | $1,958 | $102,100 | $19,800 | $82,300 |
| 2023 | $1,767 | $102,100 | $19,800 | $82,300 |
| 2022 | $1,593 | $65,600 | $13,100 | $52,500 |
| 2021 | $1,718 | $65,600 | $13,100 | $52,500 |
| 2020 | $1,623 | $65,600 | $13,100 | $52,500 |
| 2019 | $1,633 | $65,600 | $13,100 | $52,500 |
| 2018 | $1,716 | $65,600 | $13,100 | $52,500 |
| 2017 | $1,728 | $65,600 | $13,100 | $52,500 |
| 2016 | $1,680 | $65,600 | $13,100 | $52,500 |
| 2015 | $1,803 | $65,600 | $13,100 | $52,500 |
| 2014 | $1,535 | $65,600 | $13,100 | $52,500 |
| 2013 | $1,532 | $65,600 | $13,100 | $52,500 |
Source: Public Records
Map
Nearby Homes