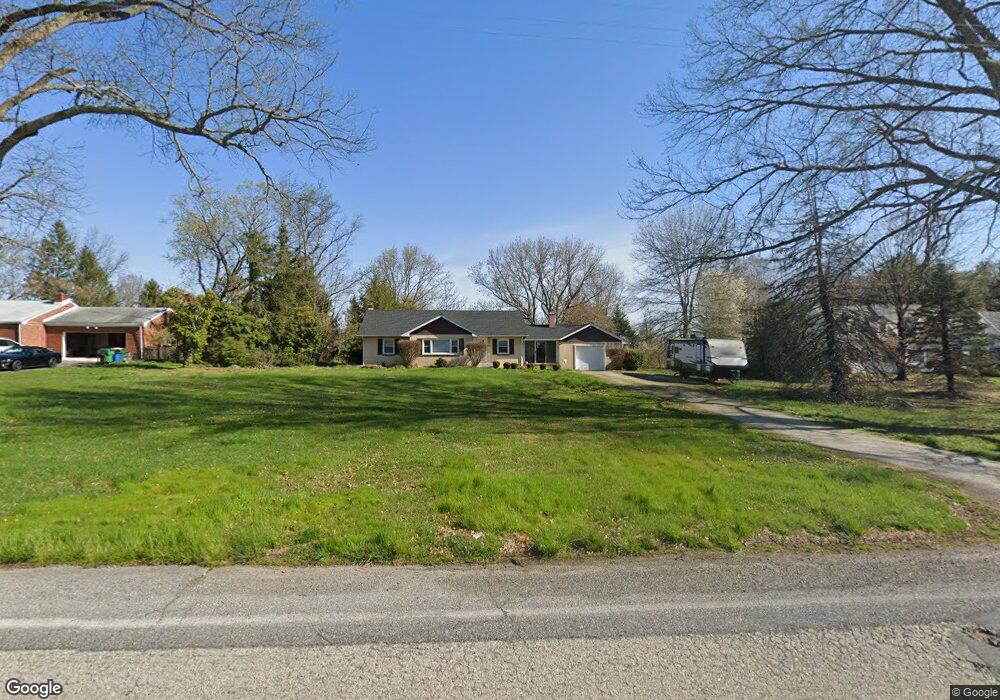
225 Marlton Rd Pilesgrove, NJ 08098
Estimated Value: $339,000 - $403,000
3
Beds
2
Baths
1,596
Sq Ft
$232/Sq Ft
Est. Value
About This Home
This home is located at 225 Marlton Rd, Pilesgrove, NJ 08098 and is currently estimated at $370,578, approximately $232 per square foot. 225 Marlton Rd is a home located in Salem County with nearby schools including Mary S. Shoemaker School and Woodstown High School.
Ownership History
Date
Name
Owned For
Owner Type
Purchase Details
Closed on
Apr 1, 2009
Sold by
Wetzel Lois E
Bought by
Smith Douglas and Smith Jennifer
Current Estimated Value
Home Financials for this Owner
Home Financials are based on the most recent Mortgage that was taken out on this home.
Original Mortgage
$205,214
Outstanding Balance
$130,284
Interest Rate
5.02%
Mortgage Type
FHA
Estimated Equity
$240,294
Create a Home Valuation Report for This Property
The Home Valuation Report is an in-depth analysis detailing your home's value as well as a comparison with similar homes in the area
Home Values in the Area
Average Home Value in this Area
Purchase History
| Date | Buyer | Sale Price | Title Company |
|---|---|---|---|
| Smith Douglas | $209,000 | -- |
Source: Public Records
Mortgage History
| Date | Status | Borrower | Loan Amount |
|---|---|---|---|
| Open | Smith Douglas | $205,214 |
Source: Public Records
Tax History Compared to Growth
Tax History
| Year | Tax Paid | Tax Assessment Tax Assessment Total Assessment is a certain percentage of the fair market value that is determined by local assessors to be the total taxable value of land and additions on the property. | Land | Improvement |
|---|---|---|---|---|
| 2025 | $8,774 | $240,000 | $106,100 | $133,900 |
| 2024 | $8,902 | $240,000 | $106,100 | $133,900 |
| 2023 | $8,902 | $240,000 | $106,100 | $133,900 |
| 2022 | $8,386 | $240,000 | $106,100 | $133,900 |
| 2021 | $8,076 | $240,000 | $106,100 | $133,900 |
| 2020 | $7,798 | $240,000 | $106,100 | $133,900 |
| 2019 | $7,570 | $240,000 | $106,100 | $133,900 |
| 2018 | $7,267 | $240,000 | $106,100 | $133,900 |
| 2017 | $7,030 | $240,000 | $106,100 | $133,900 |
| 2016 | $6,744 | $240,000 | $106,100 | $133,900 |
| 2015 | $6,240 | $240,000 | $106,100 | $133,900 |
| 2014 | $6,010 | $240,000 | $106,100 | $133,900 |
Source: Public Records
Map
Nearby Homes