225 N Ridge Heights Dr Howard, OH 43028
Apple Valley NeighborhoodEstimated Value: $296,056 - $439,000
3
Beds
2
Baths
1,400
Sq Ft
$245/Sq Ft
Est. Value
About This Home
This home is located at 225 N Ridge Heights Dr, Howard, OH 43028 and is currently estimated at $342,514, approximately $244 per square foot. 225 N Ridge Heights Dr is a home located in Knox County with nearby schools including East Knox Elementary School and East Knox High School.
Ownership History
Date
Name
Owned For
Owner Type
Purchase Details
Closed on
Jan 14, 2009
Sold by
Schlabach Builders Ltd
Bought by
Young Carl T and Haynes Linda F
Current Estimated Value
Home Financials for this Owner
Home Financials are based on the most recent Mortgage that was taken out on this home.
Original Mortgage
$123,160
Outstanding Balance
$79,291
Interest Rate
5.53%
Mortgage Type
New Conventional
Estimated Equity
$263,223
Purchase Details
Closed on
Oct 29, 2008
Sold by
Walch Daniel R and Walch Kathryn A
Bought by
Schlabach Builders Llc
Purchase Details
Closed on
Jul 12, 1996
Bought by
Walch Daniel R and Walch Kathryn
Purchase Details
Closed on
May 28, 1996
Sold by
Goolie David J
Bought by
State Of Ohio
Purchase Details
Closed on
Nov 2, 1987
Bought by
Goolie David J
Purchase Details
Closed on
May 6, 1987
Sold by
Robb Charles L and Robb Margaret
Bought by
Apple Valley Resort Inc
Create a Home Valuation Report for This Property
The Home Valuation Report is an in-depth analysis detailing your home's value as well as a comparison with similar homes in the area
Home Values in the Area
Average Home Value in this Area
Purchase History
| Date | Buyer | Sale Price | Title Company |
|---|---|---|---|
| Young Carl T | $115,500 | None Available | |
| Schlabach Builders Llc | $5,625 | None Available | |
| Walch Daniel R | -- | -- | |
| State Of Ohio | -- | -- | |
| Goolie David J | $5,000 | -- | |
| Apple Valley Resort Inc | $1,200 | -- |
Source: Public Records
Mortgage History
| Date | Status | Borrower | Loan Amount |
|---|---|---|---|
| Open | Young Carl T | $123,160 |
Source: Public Records
Tax History Compared to Growth
Tax History
| Year | Tax Paid | Tax Assessment Tax Assessment Total Assessment is a certain percentage of the fair market value that is determined by local assessors to be the total taxable value of land and additions on the property. | Land | Improvement |
|---|---|---|---|---|
| 2024 | $2,797 | $79,440 | $4,000 | $75,440 |
| 2023 | $2,797 | $79,440 | $4,000 | $75,440 |
| 2022 | $2,286 | $57,570 | $2,900 | $54,670 |
| 2021 | $2,286 | $57,570 | $2,900 | $54,670 |
| 2020 | $2,176 | $57,570 | $2,900 | $54,670 |
| 2019 | $1,977 | $49,420 | $2,850 | $46,570 |
| 2018 | $1,852 | $49,420 | $2,850 | $46,570 |
| 2017 | $1,835 | $49,420 | $2,850 | $46,570 |
| 2016 | $1,696 | $45,760 | $2,640 | $43,120 |
| 2015 | $1,544 | $45,760 | $2,640 | $43,120 |
| 2014 | $1,546 | $45,760 | $2,640 | $43,120 |
| 2013 | $1,633 | $45,850 | $3,220 | $42,630 |
Source: Public Records
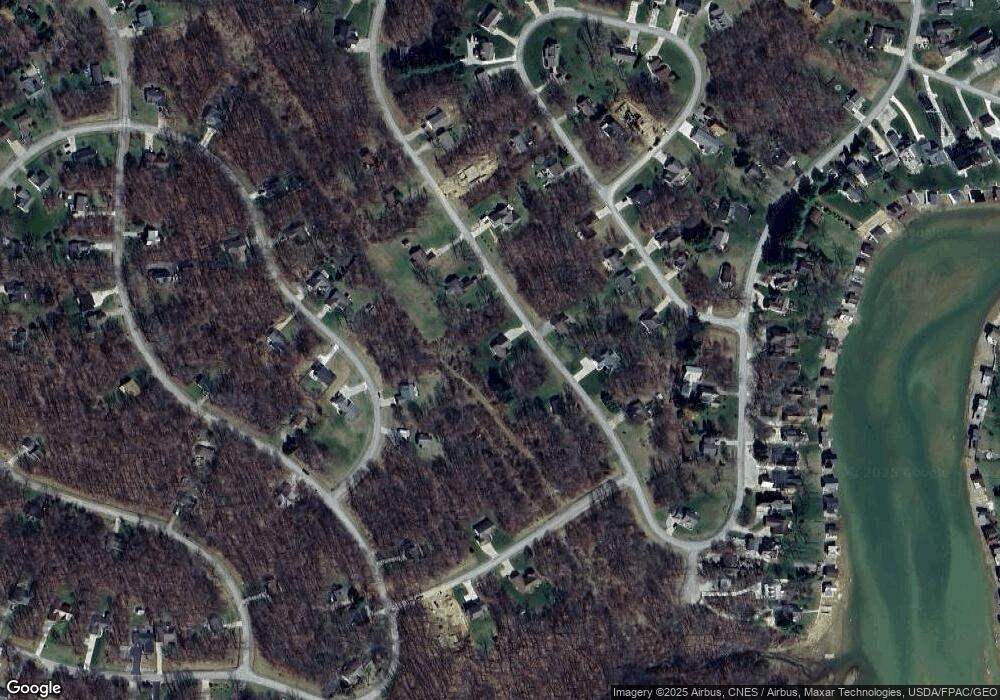
Map
Nearby Homes
- 202 Glenridge Cir
- 741 Floral Valley Dr E
- 381 N Ridge Heights Dr
- 381 Northridge Heights Dr
- 665 Highland Hills Dr
- 392 N Ridge Heights Dr
- 577 Floral Valley Dr W
- 553 Floral Valley Dr W
- 2599 Apple Valley Dr
- 2543 Apple Valley Dr
- 116 Heatherwood Dr
- 151 Heatherwood Dr
- 42 N Highland Ct
- 2527 Apple Valley Dr
- 561 Glenmonte Dr
- 956 Valleywood Heights Dr
- 434 Orchid Ct
- 431 Highland Hills Cir
- 0 Crestrose Dr Unit 20250705
- 0 Northridge Heights Dr Unit 481 225013751
- 213 N Ridge Heights Dr
- 228 N Ridge Heights Dr
- 228 N Ridge Heights Dr
- 241 N Ridge Heights Dr
- 241 N Ridge Heights Dr
- 241 N Ridge Heights Dr
- 228 Northridge Heights Dr
- 823 Daffodil Dr
- 835 Daffodil Dr
- 205 N Ridge Heights Dr
- 219 Glenridge Cir
- 223 Glenridge Cir
- 208 N Ridge Heights Dr
- 248 N Ridge Heights Dr
- 211 Glenridge Cir
- 231 Glenridge Cir
- 248 Northridge Heights Dr
- Lot 68 Floral Valley
- 826 Daffodil Dr
- 807 Daffodil Dr