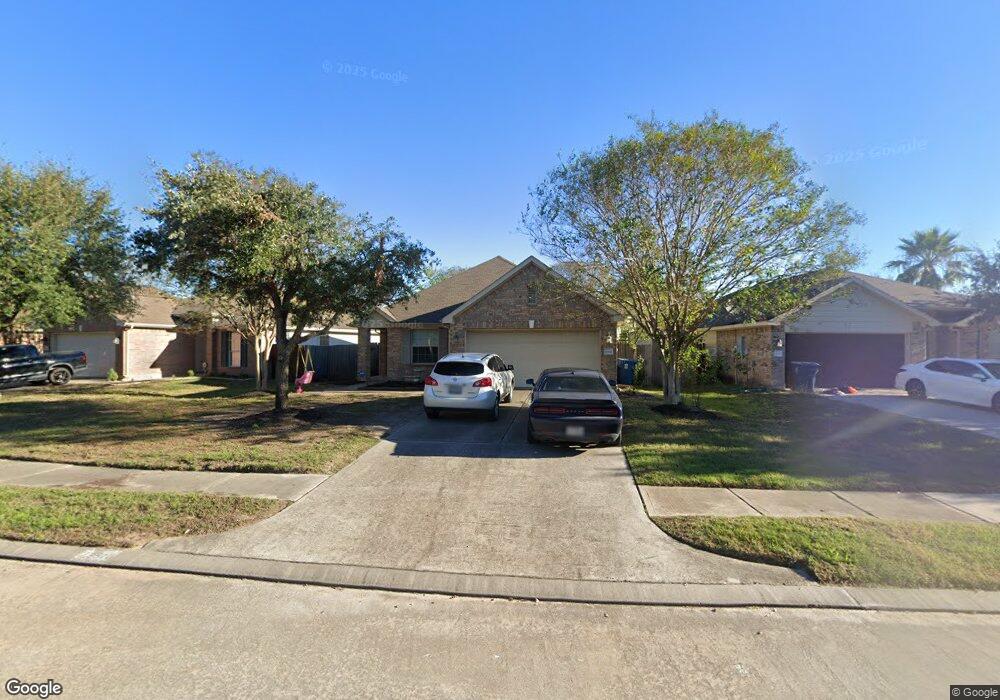
22510 Sweetglen Ct Spring, TX 77373
Estimated Value: $197,901 - $240,000
2
Beds
2
Baths
1,319
Sq Ft
$169/Sq Ft
Est. Value
About This Home
This home is located at 22510 Sweetglen Ct, Spring, TX 77373 and is currently estimated at $223,225, approximately $169 per square foot. 22510 Sweetglen Ct is a home located in Harris County with nearby schools including Ginger McNabb Elementary School, Twin Creeks Middle School, and Spring High School.
Ownership History
Date
Name
Owned For
Owner Type
Purchase Details
Closed on
May 25, 2022
Sold by
Murray Equity Llc
Bought by
Me Alpha Ii Llc
Current Estimated Value
Home Financials for this Owner
Home Financials are based on the most recent Mortgage that was taken out on this home.
Original Mortgage
$140,000
Outstanding Balance
$132,997
Interest Rate
5.25%
Mortgage Type
New Conventional
Estimated Equity
$90,228
Purchase Details
Closed on
Dec 15, 2017
Sold by
Young Ruth and Johnson Ockershausen Karen E
Bought by
Murray Equity Llc
Purchase Details
Closed on
Jul 10, 2014
Sold by
Young Ruth
Bought by
Ockershausen Karen E Johnson and Stocks Sandra Young
Purchase Details
Closed on
May 11, 2006
Sold by
Mhi Partnership Ltd
Bought by
Young Ruth
Create a Home Valuation Report for This Property
The Home Valuation Report is an in-depth analysis detailing your home's value as well as a comparison with similar homes in the area
Home Values in the Area
Average Home Value in this Area
Purchase History
| Date | Buyer | Sale Price | Title Company |
|---|---|---|---|
| Me Alpha Ii Llc | -- | New Title Company Name | |
| Murray Equity Llc | -- | Fidelity National Title | |
| Ockershausen Karen E Johnson | -- | None Available | |
| Young Ruth | -- | Millennium Title Houston |
Source: Public Records
Mortgage History
| Date | Status | Borrower | Loan Amount |
|---|---|---|---|
| Open | Me Alpha Ii Llc | $140,000 |
Source: Public Records
Tax History Compared to Growth
Tax History
| Year | Tax Paid | Tax Assessment Tax Assessment Total Assessment is a certain percentage of the fair market value that is determined by local assessors to be the total taxable value of land and additions on the property. | Land | Improvement |
|---|---|---|---|---|
| 2025 | $4,981 | $190,551 | $53,217 | $137,334 |
| 2024 | $4,981 | $180,000 | $53,217 | $126,783 |
| 2023 | $4,981 | $204,416 | $53,217 | $151,199 |
| 2022 | $4,710 | $164,618 | $26,811 | $137,807 |
| 2021 | $4,278 | $141,343 | $28,221 | $113,122 |
| 2020 | $4,284 | $134,790 | $28,221 | $106,569 |
| 2019 | $3,795 | $115,000 | $26,246 | $88,754 |
| 2018 | $641 | $70,000 | $28,221 | $41,779 |
| 2017 | $3,343 | $126,869 | $28,221 | $98,648 |
| 2016 | $3,039 | $114,620 | $28,221 | $86,399 |
| 2015 | $1,061 | $107,480 | $28,221 | $79,259 |
| 2014 | $1,061 | $90,002 | $28,221 | $61,781 |
Source: Public Records
Map
Nearby Homes
- 1406 High Thicket Ct
- 22543 Sweetglen Ct
- 1419 High Thicket Ct
- 22419 Highfield Ridge Ln
- 22730 Sunset Glen Ln
- 1314 Green Highland Dr
- 1418 Green Highland Dr
- 22902 Jetty Manor Ln
- 22903 Jetty Manor Ln
- 1203 Burnwood Ln
- 22318 Greenbrook Dr
- 22222 Greenbrook Dr
- 1119 Calderwood Dr
- 1206 Lynwood Rd
- 22010 Great Royal Ln
- 22006 Great Royal Ln
- 22007 Imperious Pkwy
- 22015 Sovereign Heights Ln
- 1006 Glouchester Ln
- 23019 Bridgewater Dr
- 22518 Sweetglen Ct
- 22502 Sweetglen Ct
- 22526 Sweetglen Ct
- 22503 Rocky Glen Ct
- 22534 Sweetglen Ct
- 22507 Rocky Glen Ct
- 22519 Sweetglen Ct
- 22515 Sweetglen Ct
- 22511 Sweetglen Ct
- 22523 Sweetglen Ct
- 1410 Rocky Glen Ln
- 1414 Rocky Glen Ln
- 22507 Sweetglen Ct
- 22527 Sweetglen Ct
- 1406 Rocky Glen Ln
- 22503 Sweetglen Ct
- 22542 Sweetglen Ct
- 22511 Rocky Glen Ct
- 22531 Sweetglen Ct
- 1418 Rocky Glen Ln