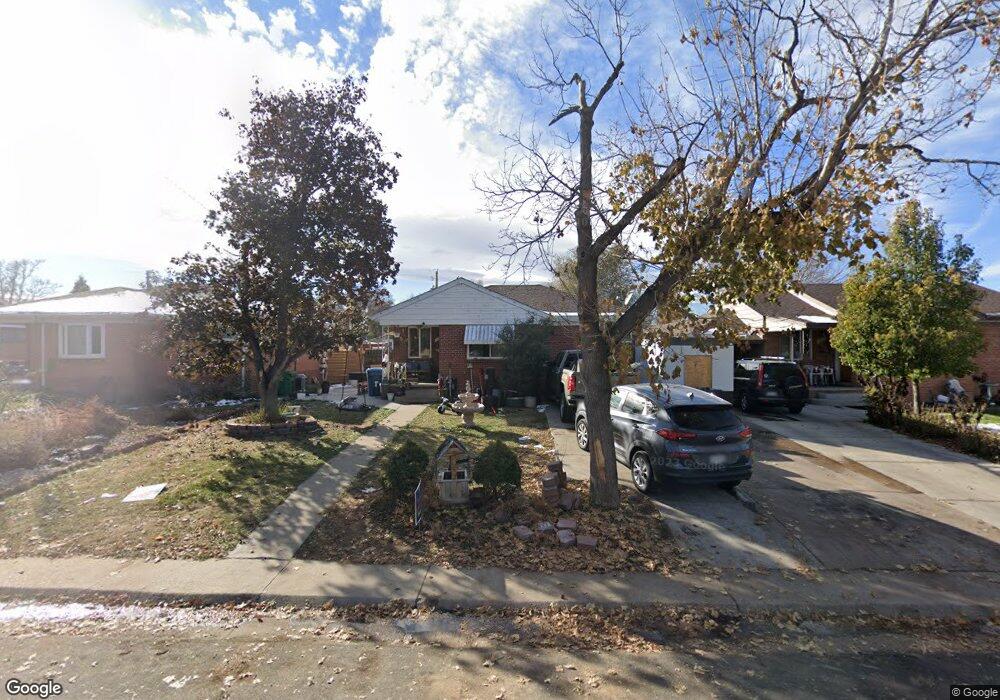
2257 Kenton St Aurora, CO 80010
North Aurora NeighborhoodEstimated Value: $382,000 - $409,000
2
Beds
1
Bath
873
Sq Ft
$451/Sq Ft
Est. Value
About This Home
This home is located at 2257 Kenton St, Aurora, CO 80010 and is currently estimated at $393,312, approximately $450 per square foot. 2257 Kenton St is a home located in Adams County with nearby schools including Montview Elementary School, Lincoln Elementary School, and Amargosa Creek Middle School.
Ownership History
Date
Name
Owned For
Owner Type
Purchase Details
Closed on
Oct 28, 2005
Sold by
Federal National Mortgage Association
Bought by
Flores Julia E
Current Estimated Value
Home Financials for this Owner
Home Financials are based on the most recent Mortgage that was taken out on this home.
Original Mortgage
$152,150
Outstanding Balance
$84,541
Interest Rate
6.37%
Mortgage Type
New Conventional
Estimated Equity
$308,771
Purchase Details
Closed on
Jul 6, 2005
Sold by
Quijada David and Lopez Martha
Bought by
Federal National Mortgage Association
Purchase Details
Closed on
Aug 31, 2000
Sold by
Bruce Kathleen J
Bought by
Quijada David and Lopez Martha
Home Financials for this Owner
Home Financials are based on the most recent Mortgage that was taken out on this home.
Original Mortgage
$160,675
Interest Rate
8.16%
Mortgage Type
FHA
Purchase Details
Closed on
Feb 10, 1994
Sold by
Cisneros Henry G
Bought by
Bruce Kathleen J
Create a Home Valuation Report for This Property
The Home Valuation Report is an in-depth analysis detailing your home's value as well as a comparison with similar homes in the area
Home Values in the Area
Average Home Value in this Area
Purchase History
| Date | Buyer | Sale Price | Title Company |
|---|---|---|---|
| Flores Julia E | $152,150 | -- | |
| Federal National Mortgage Association | -- | -- | |
| Quijada David | $162,999 | North American Title Co | |
| Bruce Kathleen J | $65,000 | -- |
Source: Public Records
Mortgage History
| Date | Status | Borrower | Loan Amount |
|---|---|---|---|
| Open | Flores Julia E | $152,150 | |
| Previous Owner | Quijada David | $160,675 |
Source: Public Records
Tax History Compared to Growth
Tax History
| Year | Tax Paid | Tax Assessment Tax Assessment Total Assessment is a certain percentage of the fair market value that is determined by local assessors to be the total taxable value of land and additions on the property. | Land | Improvement |
|---|---|---|---|---|
| 2024 | $2,504 | $24,130 | $5,000 | $19,130 |
| 2023 | $2,544 | $27,600 | $5,210 | $22,390 |
| 2022 | $2,599 | $22,870 | $5,350 | $17,520 |
| 2021 | $2,709 | $22,870 | $5,350 | $17,520 |
| 2020 | $2,777 | $23,530 | $5,510 | $18,020 |
| 2019 | $2,772 | $23,530 | $5,510 | $18,020 |
| 2018 | $1,992 | $16,840 | $4,320 | $12,520 |
| 2017 | $1,770 | $16,840 | $4,320 | $12,520 |
| 2016 | $1,330 | $12,550 | $2,390 | $10,160 |
| 2015 | $1,288 | $12,550 | $2,390 | $10,160 |
| 2014 | -- | $10,980 | $2,390 | $8,590 |
Source: Public Records
Map
Nearby Homes
- 11087 E Montview Blvd
- 11087 Montview Blvd
- 2350 Joliet St
- 2064 Ironton St
- 2241 Ironton St
- 2045 Lima St
- 2391 Kingston St
- 1902 Kenton St
- 11185 E 25th Ave
- 2028 Havana St
- 11059 E 25th Dr
- 1967 Macon St
- 10950 E 26th Ave
- 2086 Hanover St
- 11120 E 26th Ave
- 1741 Joliet St
- 1745 Jamaica St
- 2097 Hanover St
- 2572 Iola St
- 1732 Lansing St