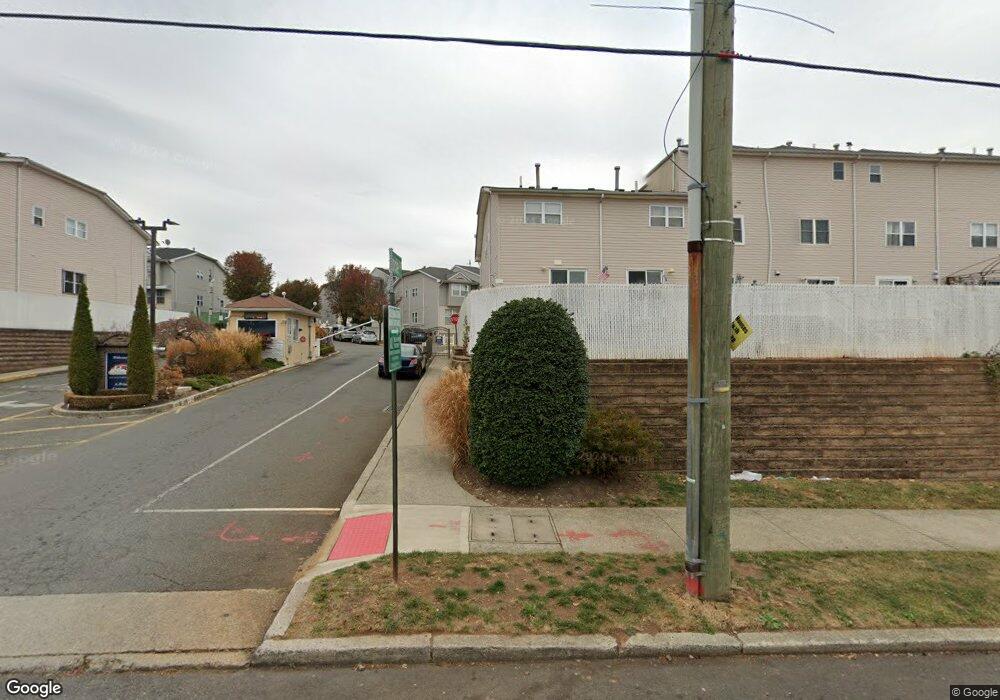
226 Skyline Dr Staten Island, NY 10304
Clifton NeighborhoodEstimated Value: $536,669 - $703,000
3
Beds
3
Baths
2,730
Sq Ft
$231/Sq Ft
Est. Value
About This Home
This home is located at 226 Skyline Dr, Staten Island, NY 10304 and is currently estimated at $630,417, approximately $230 per square foot. 226 Skyline Dr is a home located in Richmond County with nearby schools including Ps 13 M L Lindenmeyer, I.S. 49 Berta A Dreyfus, and New Dorp High School.
Ownership History
Date
Name
Owned For
Owner Type
Purchase Details
Closed on
Jun 20, 2005
Sold by
Lui Kwong Lok Kevin and Mok Susana
Bought by
Massaly Malang and Massaly Aissa
Current Estimated Value
Home Financials for this Owner
Home Financials are based on the most recent Mortgage that was taken out on this home.
Original Mortgage
$295,816
Outstanding Balance
$151,841
Interest Rate
5.5%
Mortgage Type
Fannie Mae Freddie Mac
Estimated Equity
$478,576
Purchase Details
Closed on
Jan 24, 2004
Sold by
Lui Kwong Lok Kevin
Bought by
Lui Kwong Lok Kevin and Mok Susana
Purchase Details
Closed on
Jul 17, 2002
Sold by
Nyc Partnership Housing Development Fund
Bought by
Lui Kwong Lok Kevin
Home Financials for this Owner
Home Financials are based on the most recent Mortgage that was taken out on this home.
Original Mortgage
$158,400
Interest Rate
6.36%
Mortgage Type
Purchase Money Mortgage
Create a Home Valuation Report for This Property
The Home Valuation Report is an in-depth analysis detailing your home's value as well as a comparison with similar homes in the area
Home Values in the Area
Average Home Value in this Area
Purchase History
| Date | Buyer | Sale Price | Title Company |
|---|---|---|---|
| Massaly Malang | $369,770 | -- | |
| Lui Kwong Lok Kevin | -- | Commonwealth Land Title Insu | |
| Lui Kwong Lok Kevin | $181,500 | -- |
Source: Public Records
Mortgage History
| Date | Status | Borrower | Loan Amount |
|---|---|---|---|
| Open | Massaly Malang | $295,816 | |
| Previous Owner | Lui Kwong Lok Kevin | $158,400 | |
| Closed | Massaly Malang | $73,954 |
Source: Public Records
Tax History Compared to Growth
Tax History
| Year | Tax Paid | Tax Assessment Tax Assessment Total Assessment is a certain percentage of the fair market value that is determined by local assessors to be the total taxable value of land and additions on the property. | Land | Improvement |
|---|---|---|---|---|
| 2025 | $3,415 | $31,920 | $2,970 | $28,950 |
| 2024 | $2,609 | $29,820 | $2,999 | $26,821 |
| 2023 | $3,453 | $18,403 | $2,878 | $15,525 |
| 2022 | $3,359 | $26,880 | $4,860 | $22,020 |
| 2021 | $3,323 | $23,220 | $4,860 | $18,360 |
| 2020 | $3,145 | $21,900 | $4,860 | $17,040 |
| 2019 | $2,915 | $19,020 | $4,860 | $14,160 |
| 2018 | $2,829 | $15,336 | $4,168 | $11,168 |
| 2017 | $2,803 | $15,219 | $4,549 | $10,670 |
| 2016 | $2,560 | $14,358 | $4,422 | $9,936 |
| 2015 | $2,148 | $13,546 | $4,240 | $9,306 |
| 2014 | $2,148 | $12,780 | $4,320 | $8,460 |
Source: Public Records
Map
Nearby Homes
- 33 Geo Ct
- 42 Studio Ln
- 119 Skyline Dr
- 59 Bell St
- 22 Long Pond Ln
- 16 Burgundy Loop
- 208 Osgood Ave
- 48 White Plains Ave
- 202 Chestnut Ave
- 21 Leewood Loop
- 99 Park Hill Cir
- 208 Saint Marys Ave
- 212 Saint Marys Ave
- 189 Saint Marys Ave
- 446 Tompkins Ave
- 89 Park Hill Ct
- 330 Virginia Ave
- 233 Mosel Ave
- 338 Clifton Ave
- 99 Reynolds St