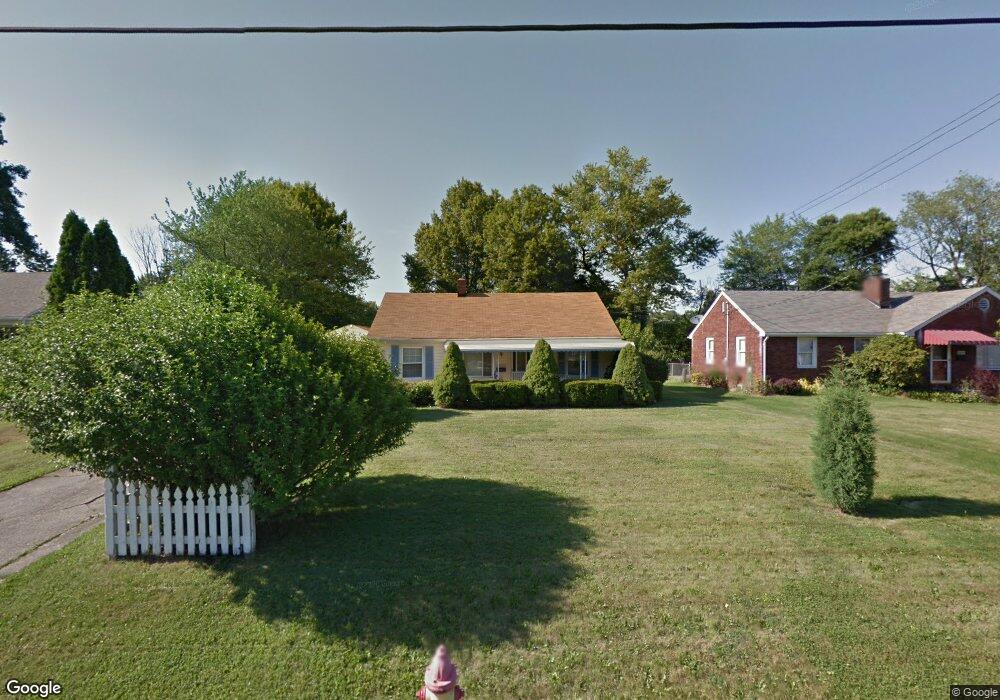
2260 Venloe Dr Youngstown, OH 44514
Estimated Value: $153,063 - $191,000
2
Beds
1
Bath
1,088
Sq Ft
$158/Sq Ft
Est. Value
About This Home
This home is located at 2260 Venloe Dr, Youngstown, OH 44514 and is currently estimated at $172,016, approximately $158 per square foot. 2260 Venloe Dr is a home located in Mahoning County with nearby schools including Poland Union Elementary School, Poland Middle School, and Poland Seminary High School.
Ownership History
Date
Name
Owned For
Owner Type
Purchase Details
Closed on
May 25, 2017
Sold by
Modelski Andrew
Bought by
Modelski Krzysztof and Modelski Piotr
Current Estimated Value
Purchase Details
Closed on
Sep 7, 2007
Sold by
Naples Samuel and Countrywide Home Loans Inc
Bought by
Fanniemae and Federal National Mortgage Association
Purchase Details
Closed on
Aug 13, 1999
Sold by
Kraynack Simon Therese M and Foos Theresa M
Bought by
Naples Samuel
Home Financials for this Owner
Home Financials are based on the most recent Mortgage that was taken out on this home.
Original Mortgage
$67,200
Interest Rate
7.77%
Purchase Details
Closed on
Mar 7, 1997
Sold by
Watson Mary M
Bought by
Simon Therese M
Home Financials for this Owner
Home Financials are based on the most recent Mortgage that was taken out on this home.
Original Mortgage
$58,300
Interest Rate
7.93%
Mortgage Type
New Conventional
Purchase Details
Closed on
Jun 18, 1991
Bought by
Watson Mary M
Create a Home Valuation Report for This Property
The Home Valuation Report is an in-depth analysis detailing your home's value as well as a comparison with similar homes in the area
Home Values in the Area
Average Home Value in this Area
Purchase History
| Date | Buyer | Sale Price | Title Company |
|---|---|---|---|
| Modelski Krzysztof | -- | None Available | |
| Fanniemae | $54,000 | None Available | |
| Naples Samuel | $76,000 | -- | |
| Simon Therese M | $72,900 | -- | |
| Watson Mary M | $61,500 | -- |
Source: Public Records
Mortgage History
| Date | Status | Borrower | Loan Amount |
|---|---|---|---|
| Previous Owner | Naples Samuel | $67,200 | |
| Previous Owner | Simon Therese M | $58,300 |
Source: Public Records
Tax History Compared to Growth
Tax History
| Year | Tax Paid | Tax Assessment Tax Assessment Total Assessment is a certain percentage of the fair market value that is determined by local assessors to be the total taxable value of land and additions on the property. | Land | Improvement |
|---|---|---|---|---|
| 2024 | $1,950 | $38,400 | $8,740 | $29,660 |
| 2023 | $1,907 | $38,400 | $8,740 | $29,660 |
| 2022 | $1,488 | $24,960 | $8,010 | $16,950 |
| 2021 | $1,422 | $24,960 | $8,010 | $16,950 |
| 2020 | $1,427 | $24,960 | $8,010 | $16,950 |
| 2019 | $1,462 | $23,420 | $8,010 | $15,410 |
| 2018 | $1,375 | $23,420 | $8,010 | $15,410 |
| 2017 | $1,462 | $23,420 | $8,010 | $15,410 |
| 2016 | $1,573 | $25,990 | $8,010 | $17,980 |
| 2015 | $1,541 | $25,990 | $8,010 | $17,980 |
| 2014 | $1,547 | $25,990 | $8,010 | $17,980 |
| 2013 | $1,529 | $25,990 | $8,010 | $17,980 |
Source: Public Records
Map
Nearby Homes
- 2307 Hamilton Ave
- 2295 Bel Aire Ln
- 42 Edgewater Dr
- 2411 Lyon Blvd
- 5838 Poland Struthers Rd
- 2153 Lyon Blvd
- 2379 Clyde St
- 43 Venloe Dr
- 34 Venloe Dr
- 2128 Lyon Blvd
- 154 Rocky Ledge Dr
- 2035 Woodward Ave
- 2296 Knollwood Ave
- 2061 Mathews Rd
- 25 Lakeshore Dr
- 5710 Youngstown Poland Rd
- 764 Poland Ave
- 6074 Frontier Dr
- 2541 W Manor Ave
- 2721 Algonquin Dr
- 2272 Venloe Dr
- 2238 Venloe Dr
- 2261 Edgewater Dr
- 2284 Venloe Dr
- 2226 Venloe Dr
- 2249 Edgewater Dr
- 2273 Edgewater Dr
- 2239 Edgewater Dr
- 2257 Venloe Dr
- 2285 Edgewater Dr
- 2271 Venloe Dr
- 2239 Venloe Dr
- 2227 Edgewater Dr
- 2216 Venloe Dr
- 2300 Venloe Dr
- 2295 Edgewater Dr
- 2285 Venloe Dr
- 2227 Venloe Dr
- 2217 Edgewater Dr
- 2307 Edgewater Dr