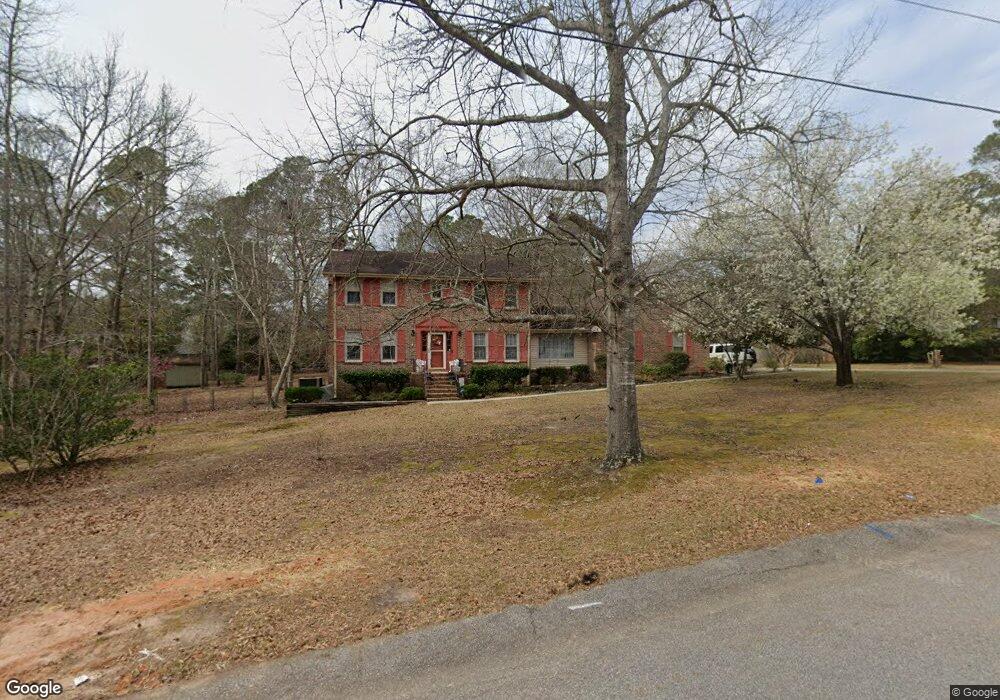
2263 Pineridge St Orangeburg, SC 29118
Estimated Value: $218,000 - $330,000
3
Beds
3
Baths
2,147
Sq Ft
$123/Sq Ft
Est. Value
About This Home
This home is located at 2263 Pineridge St, Orangeburg, SC 29118 and is currently estimated at $263,264, approximately $122 per square foot. 2263 Pineridge St is a home located in Orangeburg County with nearby schools including Marshall Elementary School, Marshall Elementary, and William J. Clark Middle School.
Ownership History
Date
Name
Owned For
Owner Type
Purchase Details
Closed on
Nov 29, 2017
Sold by
Hardy Charles E
Bought by
Hardy Charles E and Hardy Barbara
Current Estimated Value
Home Financials for this Owner
Home Financials are based on the most recent Mortgage that was taken out on this home.
Original Mortgage
$178,709
Outstanding Balance
$150,457
Interest Rate
3.94%
Mortgage Type
VA
Estimated Equity
$112,807
Purchase Details
Closed on
Feb 10, 2006
Sold by
Kauppila Lawrence J and Kauppila Aleta B
Bought by
Hardy Charles E
Home Financials for this Owner
Home Financials are based on the most recent Mortgage that was taken out on this home.
Original Mortgage
$172,900
Interest Rate
8.55%
Mortgage Type
Adjustable Rate Mortgage/ARM
Purchase Details
Closed on
Oct 16, 2000
Sold by
Ferguson Timothy James and Ferguson Sherry L
Bought by
Kauppila Lawrence J and Kauppila Aleta B
Create a Home Valuation Report for This Property
The Home Valuation Report is an in-depth analysis detailing your home's value as well as a comparison with similar homes in the area
Home Values in the Area
Average Home Value in this Area
Purchase History
| Date | Buyer | Sale Price | Title Company |
|---|---|---|---|
| Hardy Charles E | -- | None Available | |
| Hardy Charles E | $182,000 | None Available | |
| Kauppila Lawrence J | $150,050 | -- |
Source: Public Records
Mortgage History
| Date | Status | Borrower | Loan Amount |
|---|---|---|---|
| Open | Hardy Charles E | $178,709 | |
| Previous Owner | Hardy Charles E | $172,900 |
Source: Public Records
Tax History Compared to Growth
Tax History
| Year | Tax Paid | Tax Assessment Tax Assessment Total Assessment is a certain percentage of the fair market value that is determined by local assessors to be the total taxable value of land and additions on the property. | Land | Improvement |
|---|---|---|---|---|
| 2024 | $1,936 | $8,279 | $1,011 | $7,268 |
| 2023 | $1,730 | $5,927 | $971 | $4,956 |
| 2022 | $1,612 | $5,927 | $971 | $4,956 |
| 2021 | $1,600 | $5,927 | $971 | $4,956 |
| 2020 | $1,576 | $5,927 | $971 | $4,956 |
| 2019 | $1,582 | $5,927 | $971 | $4,956 |
| 2018 | $1,503 | $5,903 | $971 | $4,932 |
| 2017 | $1,445 | $5,903 | $0 | $0 |
| 2016 | $1,445 | $5,903 | $0 | $0 |
| 2015 | $843 | $5,903 | $0 | $0 |
| 2014 | $843 | $5,903 | $971 | $4,932 |
| 2013 | -- | $6,167 | $971 | $5,196 |
Source: Public Records
Map
Nearby Homes
- 2395 Lakeside St
- 2136 Pinnacle St
- 2415 Riley St
- 2358 Northview Dr Unit 2B
- 2354 Northview Dr Unit 2A
- 2251 Hillcrest Ave Unit 6C
- 2753 Hillcrest Ave
- 2336 Northview Dr Unit 3-C
- 2753 Hillcrest St NE
- 2348 Northview Dr Unit 3F
- 2320 Mall Terrace Ct Unit 2320
- 2220 Hillside St NE
- 2220 Hillside St
- 00 Riley St
- 0 Riley St
- 2778 Riley St
- 2160 Chestnut St
- 2069 Hydrick Ave
- 2249 Chestnut St
- 0 Old Riley St
- 2231 Pineridge St
- 2279 Pineridge St
- 2360 Lakeside St
- 2322 Lakeside St
- 2322 Lakeside St
- 2322 Lakeside St
- 2322 Lakeside St
- 2260 Pineridge St
- 2420 Lakeside St
- 2282 Pineridge St
- 2197 Pineridge St
- 2498 Lakeside Dr NE
- 2218 Pineridge St
- 2464 Lakeside Dr NE
- 2464 Lakeside St
- 2498 Lakeside St
- 2290 Lakeside St
- 2550 Lakeside Dr NE
- 2550 Lakeside St
- 2193 Pineridge St