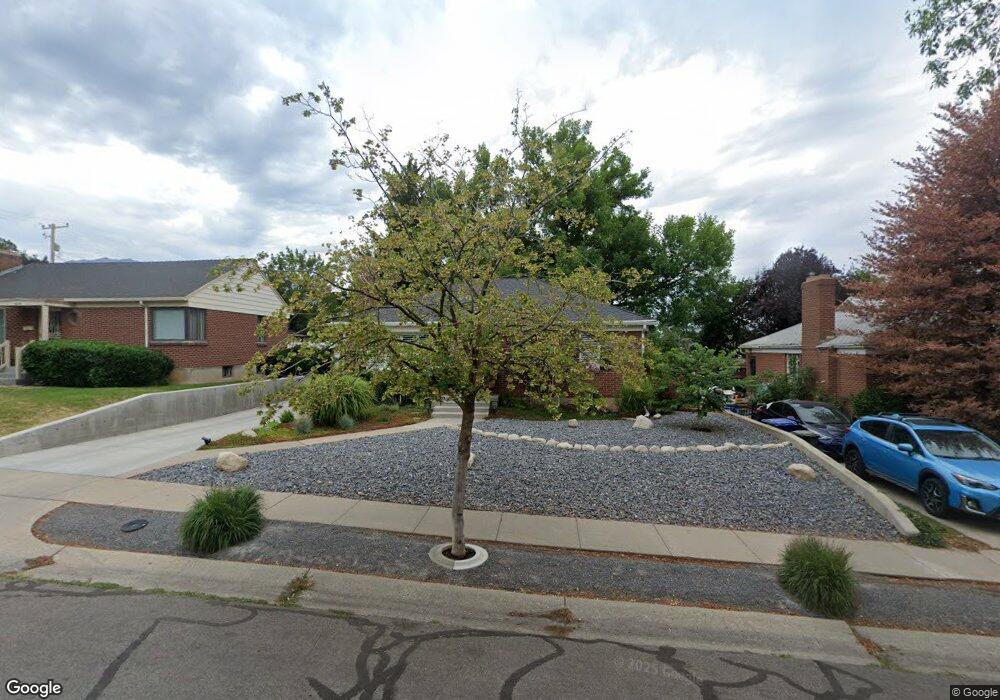
2266 Downington Ave Salt Lake City, UT 84108
Sugar House NeighborhoodEstimated Value: $684,000 - $710,000
4
Beds
2
Baths
875
Sq Ft
$798/Sq Ft
Est. Value
About This Home
This home is located at 2266 Downington Ave, Salt Lake City, UT 84108 and is currently estimated at $697,926, approximately $797 per square foot. 2266 Downington Ave is a home located in Salt Lake County with nearby schools including Dilworth Elementary School, Hillside Middle School, and Highland High School.
Ownership History
Date
Name
Owned For
Owner Type
Purchase Details
Closed on
Mar 8, 2002
Sold by
Lloyd Larry T and Lloyd Linda Lee
Bought by
Lloyd Larry T and Lloyd Linda Lee
Current Estimated Value
Home Financials for this Owner
Home Financials are based on the most recent Mortgage that was taken out on this home.
Original Mortgage
$20,000
Outstanding Balance
$8,284
Interest Rate
6.94%
Estimated Equity
$689,642
Purchase Details
Closed on
Nov 24, 1997
Sold by
Chase Jerry
Bought by
Lloyd Larry T and Reeder Linda Lee
Home Financials for this Owner
Home Financials are based on the most recent Mortgage that was taken out on this home.
Original Mortgage
$94,900
Outstanding Balance
$15,643
Interest Rate
7.33%
Estimated Equity
$682,283
Purchase Details
Closed on
Oct 18, 1995
Sold by
Hanson Patricia H
Bought by
Chase Jerry
Home Financials for this Owner
Home Financials are based on the most recent Mortgage that was taken out on this home.
Original Mortgage
$93,750
Interest Rate
7.67%
Create a Home Valuation Report for This Property
The Home Valuation Report is an in-depth analysis detailing your home's value as well as a comparison with similar homes in the area
Home Values in the Area
Average Home Value in this Area
Purchase History
| Date | Buyer | Sale Price | Title Company |
|---|---|---|---|
| Lloyd Larry T | -- | Associated Title | |
| Lloyd Larry T | -- | -- | |
| Chase Jerry | -- | -- | |
| Chase Jerry | -- | -- |
Source: Public Records
Mortgage History
| Date | Status | Borrower | Loan Amount |
|---|---|---|---|
| Open | Lloyd Larry T | $20,000 | |
| Open | Lloyd Larry T | $94,900 | |
| Previous Owner | Chase Jerry | $93,750 |
Source: Public Records
Tax History Compared to Growth
Tax History
| Year | Tax Paid | Tax Assessment Tax Assessment Total Assessment is a certain percentage of the fair market value that is determined by local assessors to be the total taxable value of land and additions on the property. | Land | Improvement |
|---|---|---|---|---|
| 2025 | $3,261 | $655,300 | $180,200 | $475,100 |
| 2024 | $3,261 | $622,200 | $171,900 | $450,300 |
| 2023 | $3,329 | $612,300 | $165,300 | $447,000 |
| 2022 | $3,557 | $613,800 | $162,100 | $451,700 |
| 2021 | $3,193 | $498,900 | $132,100 | $366,800 |
| 2020 | $2,684 | $399,100 | $123,500 | $275,600 |
| 2019 | $2,708 | $378,800 | $116,000 | $262,800 |
| 2018 | $2,607 | $355,200 | $116,000 | $239,200 |
| 2017 | $2,647 | $337,900 | $116,000 | $221,900 |
| 2016 | $2,573 | $311,900 | $109,100 | $202,800 |
| 2015 | $2,526 | $290,200 | $112,400 | $177,800 |
| 2014 | $2,479 | $282,500 | $112,400 | $170,100 |
Source: Public Records
Map
Nearby Homes
- 2225 Ramona Ave
- 2138 E Wilson Ave
- 2326 E 1700 S
- 2366 Logan Ave S
- 1940 S 2500 E
- 2109 S Texas St
- 2125 Logan Ave S
- 1769 S Foothill Dr
- 2266 E Kensington Ave
- 2119 King St
- 2009 E Hollywood Ave
- 1980 Downington Ave S
- 1974 Laurelhurst Dr E
- 1881 Foothill Dr
- 1876 S 2600 E
- 1502 S 2400 E
- 1908 S 2600 E
- 1977 E Sylvan Ave
- 1970 Logan Ave S
- 1825 S 2600 E
- 2274 Downington Ave
- 2256 Downington Ave
- 2284 Downington Ave
- 2248 Downington Ave
- 2265 Garfield Ave
- 2265 E Garfield Ave
- 2273 Garfield Ave
- 2255 Garfield Ave
- 2283 Garfield Ave
- 2247 Garfield Ave
- 2247 E Garfield Ave
- 2283 E Garfield Ave
- 2267 Downington Ave
- 2246 E Downington Ave
- 2246 Downington Ave
- 2259 Downington Ave S
- 2259 Downington Ave
- 2275 Downington Ave
- 2253 E Downington Ave
- 2253 Downington Ave