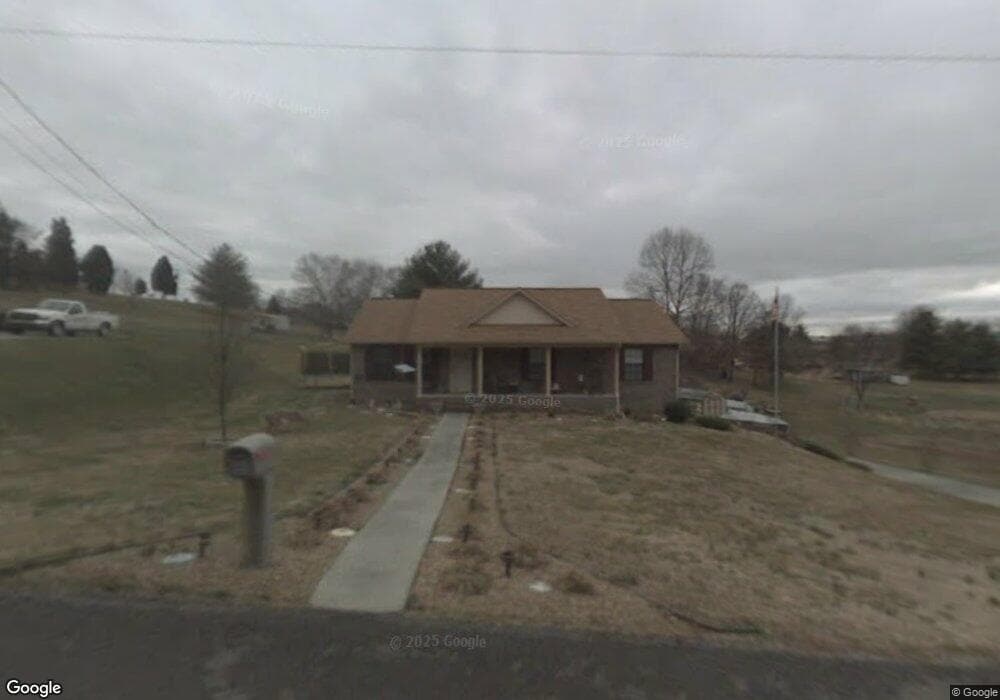
2269 Grazeland Dr Morristown, TN 37814
Estimated Value: $253,351 - $329,000
--
Bed
2
Baths
1,372
Sq Ft
$215/Sq Ft
Est. Value
About This Home
This home is located at 2269 Grazeland Dr, Morristown, TN 37814 and is currently estimated at $294,838, approximately $214 per square foot. 2269 Grazeland Dr is a home located in Hamblen County with nearby schools including Russellville Elementary School, East Ridge Middle School, and Morristown East High School.
Ownership History
Date
Name
Owned For
Owner Type
Purchase Details
Closed on
Jul 14, 1997
Sold by
Virginia Mayes
Bought by
Ted Everhart
Current Estimated Value
Home Financials for this Owner
Home Financials are based on the most recent Mortgage that was taken out on this home.
Original Mortgage
$86,900
Outstanding Balance
$12,674
Interest Rate
7.7%
Estimated Equity
$282,164
Purchase Details
Closed on
Oct 4, 1995
Sold by
Williamson James E
Bought by
Mayes Virginia Sue
Purchase Details
Closed on
Jun 7, 1995
Sold by
Humphrey Paul R and Humphrey Tommy
Bought by
Williamson James E
Purchase Details
Closed on
May 10, 1995
Sold by
Humphrey Paul
Bought by
Humphrey Paul R and Humphrey Tommy
Purchase Details
Closed on
Mar 8, 1995
Sold by
Humphrey Paul
Bought by
Paul Humphrey
Purchase Details
Closed on
May 31, 1983
Bought by
Mcdonald Harold and Mcdonald Ruby B
Purchase Details
Closed on
Aug 24, 1982
Bought by
Hamilton Bank Of Morristown
Purchase Details
Closed on
Aug 4, 1978
Bought by
Holder Frank
Create a Home Valuation Report for This Property
The Home Valuation Report is an in-depth analysis detailing your home's value as well as a comparison with similar homes in the area
Home Values in the Area
Average Home Value in this Area
Purchase History
| Date | Buyer | Sale Price | Title Company |
|---|---|---|---|
| Ted Everhart | $91,500 | -- | |
| Mayes Virginia Sue | $89,900 | -- | |
| Williamson James E | $85,000 | -- | |
| Humphrey Paul R | $17,000 | -- | |
| Paul Humphrey | $17,000 | -- | |
| Mcdonald Harold | -- | -- | |
| Hamilton Bank Of Morristown | -- | -- | |
| Holder Frank | -- | -- |
Source: Public Records
Mortgage History
| Date | Status | Borrower | Loan Amount |
|---|---|---|---|
| Open | Holder Frank | $86,900 |
Source: Public Records
Tax History Compared to Growth
Tax History
| Year | Tax Paid | Tax Assessment Tax Assessment Total Assessment is a certain percentage of the fair market value that is determined by local assessors to be the total taxable value of land and additions on the property. | Land | Improvement |
|---|---|---|---|---|
| 2024 | $689 | $34,975 | $4,825 | $30,150 |
| 2023 | $689 | $34,975 | $0 | $0 |
| 2022 | $689 | $34,975 | $4,825 | $30,150 |
| 2021 | $689 | $34,975 | $4,825 | $30,150 |
| 2020 | $689 | $34,975 | $4,825 | $30,150 |
| 2019 | $674 | $31,625 | $4,400 | $27,225 |
| 2018 | $674 | $31,625 | $4,400 | $27,225 |
| 2017 | $674 | $31,625 | $4,400 | $27,225 |
| 2016 | $629 | $31,625 | $4,400 | $27,225 |
| 2015 | $585 | $31,625 | $4,400 | $27,225 |
| 2014 | -- | $31,625 | $4,400 | $27,225 |
| 2013 | -- | $36,000 | $0 | $0 |
Source: Public Records
Map
Nearby Homes
- 5110 Anne Cir
- 4475 Copeland Dr
- 2551 Cedar Creek Rd
- 4959 Brights Pike
- 5556 Denton Dr
- 3800 Dan Dr
- 1708 Boardwalk Cir
- 4119 Azalea Ct
- 4146 Leslie Dr
- 3835 High Oak Dr
- 1881 Raven Rd
- 4547 Brights Pike
- 5601 Brights Pike
- 5659 Browning Way
- Lot 17 Waters Edge Dr
- 4801 Harbor Dr
- 5085 Old Kentucky Rd
- 354 Volunteer Dr
- 2255 Grazeland Dr
- 2.4 Acres Grazeland Dr
- 2260 Old Ford Rd
- 2287 Grazeland Dr
- 2278 Grazeland Dr
- 2290 Old Ford Rd
- 2244 Old Ford Rd
- 2294 Old Ford Rd
- 00 Grazeland Dr
- 0 Grazeland Dr
- 2284 Grazeland Dr
- 2296 Grazeland Dr
- 2261 Old Ford Rd
- 2287 Old Ford Rd
- 2241 Old Ford Rd
- 2321 Grazeland Dr
- 4962 Betsy Ln
- 2315 Old Ford Rd
- 2220 Vennie Cir
- 4961 Betsy Ln