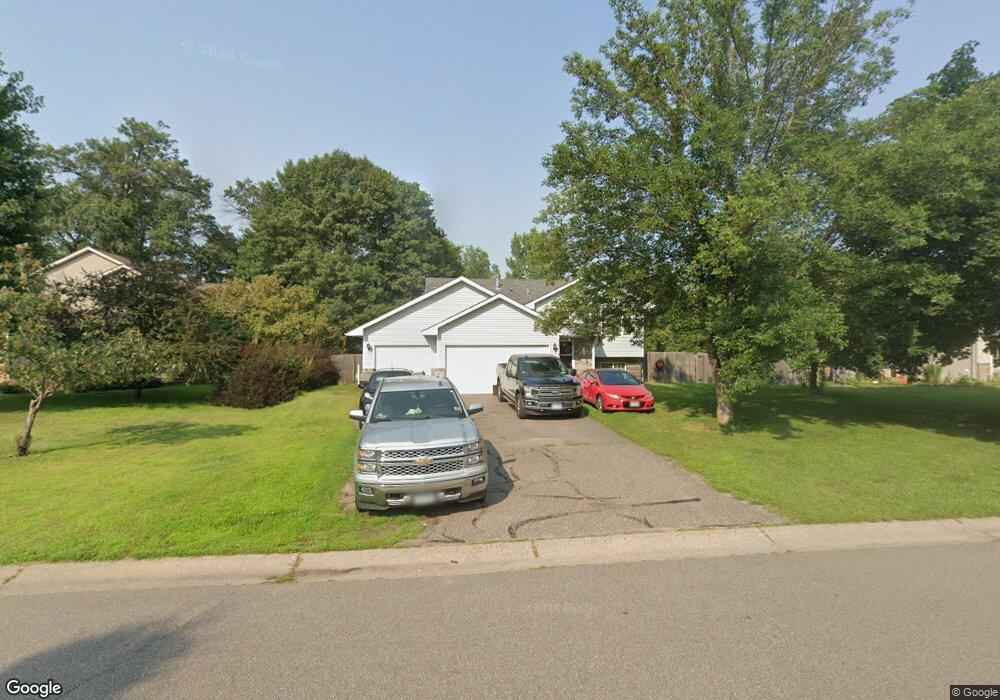
22719 Vintage St NW Saint Francis, MN 55070
Estimated Value: $353,000 - $379,000
3
Beds
2
Baths
1,092
Sq Ft
$338/Sq Ft
Est. Value
About This Home
This home is located at 22719 Vintage St NW, Saint Francis, MN 55070 and is currently estimated at $368,683, approximately $337 per square foot. 22719 Vintage St NW is a home located in Anoka County with nearby schools including St. Francis Elementary School, St. Francis Middle School, and St. Francis High School.
Ownership History
Date
Name
Owned For
Owner Type
Purchase Details
Closed on
May 17, 2017
Sold by
Bjur Rachelle E and Bjur Matthew J
Bought by
Lee Yer and Cortes Lee Jessica
Current Estimated Value
Home Financials for this Owner
Home Financials are based on the most recent Mortgage that was taken out on this home.
Original Mortgage
$221,000
Outstanding Balance
$183,435
Interest Rate
4.03%
Mortgage Type
VA
Estimated Equity
$185,248
Purchase Details
Closed on
Apr 24, 2008
Sold by
Collins James H and Boecher Bernadine
Bought by
Bjur Matthew J and Englund Rachelle E
Home Financials for this Owner
Home Financials are based on the most recent Mortgage that was taken out on this home.
Original Mortgage
$166,400
Interest Rate
5.88%
Mortgage Type
New Conventional
Purchase Details
Closed on
Sep 15, 1996
Sold by
Kenco Construction Inc
Bought by
Collins James H and Boecher Bernardine C
Create a Home Valuation Report for This Property
The Home Valuation Report is an in-depth analysis detailing your home's value as well as a comparison with similar homes in the area
Home Values in the Area
Average Home Value in this Area
Purchase History
| Date | Buyer | Sale Price | Title Company |
|---|---|---|---|
| Lee Yer | $221,000 | Edina Realty Title Inc | |
| Bjur Matthew J | $208,000 | -- | |
| Collins James H | $122,800 | -- |
Source: Public Records
Mortgage History
| Date | Status | Borrower | Loan Amount |
|---|---|---|---|
| Open | Lee Yer | $221,000 | |
| Previous Owner | Bjur Matthew J | $166,400 |
Source: Public Records
Tax History Compared to Growth
Tax History
| Year | Tax Paid | Tax Assessment Tax Assessment Total Assessment is a certain percentage of the fair market value that is determined by local assessors to be the total taxable value of land and additions on the property. | Land | Improvement |
|---|---|---|---|---|
| 2025 | $3,334 | $361,800 | $98,700 | $263,100 |
| 2024 | $3,334 | $312,600 | $69,000 | $243,600 |
| 2023 | $2,975 | $306,300 | $60,000 | $246,300 |
| 2022 | $2,654 | $312,400 | $57,000 | $255,400 |
| 2021 | $2,685 | $253,200 | $35,000 | $218,200 |
| 2020 | $2,600 | $239,000 | $35,000 | $204,000 |
| 2019 | $2,543 | $232,900 | $35,000 | $197,900 |
| 2018 | $2,450 | $215,100 | $0 | $0 |
| 2017 | $2,269 | $199,300 | $0 | $0 |
| 2016 | $2,301 | $179,900 | $0 | $0 |
| 2015 | $2,223 | $179,900 | $34,700 | $145,200 |
| 2014 | -- | $163,100 | $34,700 | $128,400 |
Source: Public Records
Map
Nearby Homes
- 3728 227th Ct NW
- 3662 225th Ln NW
- 22509 Tulip St NW
- 3806 225th Ln NW
- 22560 Poppy St NW
- 3428 227th Ave NW
- 22922 Silverod St NW
- 3518 Bridge St NW
- 23037 Ambassador Blvd NW
- 4142 228th Ave NW
- 4149 228th Ave NW
- 22232 Xenia St NW
- 4201 Saint Francis Blvd NW
- 383X 221st Ln NW
- 23240 Vintage St NW
- 4107 232nd Ave NW
- 23016 Eidelweiss St NW
- 3665 235th Ln NW
- 23041 Eidelweiss St NW
- 3308 235th Ave NW
- 22729 Vintage St NW
- 22729 22729 Vintage St NW
- 22709 Vintage St NW
- 22709 22709 Vintage-Street-nw
- 22709 22709 Vintage St NW
- 3715 3715 227th Ave NW
- 22747 Vintage St NW
- 3715 227th Ave NW
- 22661 Vintage St NW
- 3728 3728 227th Ct NW
- 3727 227th Ave NW
- 3727 3727 227th-Avenue-nw
- 22753 22753 Vintage St NW
- 22753 Vintage St NW
- 22650 Vintage St NW
- 22645 Vintage St NW
- 3716 227th Ave NW
- 3735 227th Ave NW
- 22640 Vintage St NW
- 3729 227th Ct NW