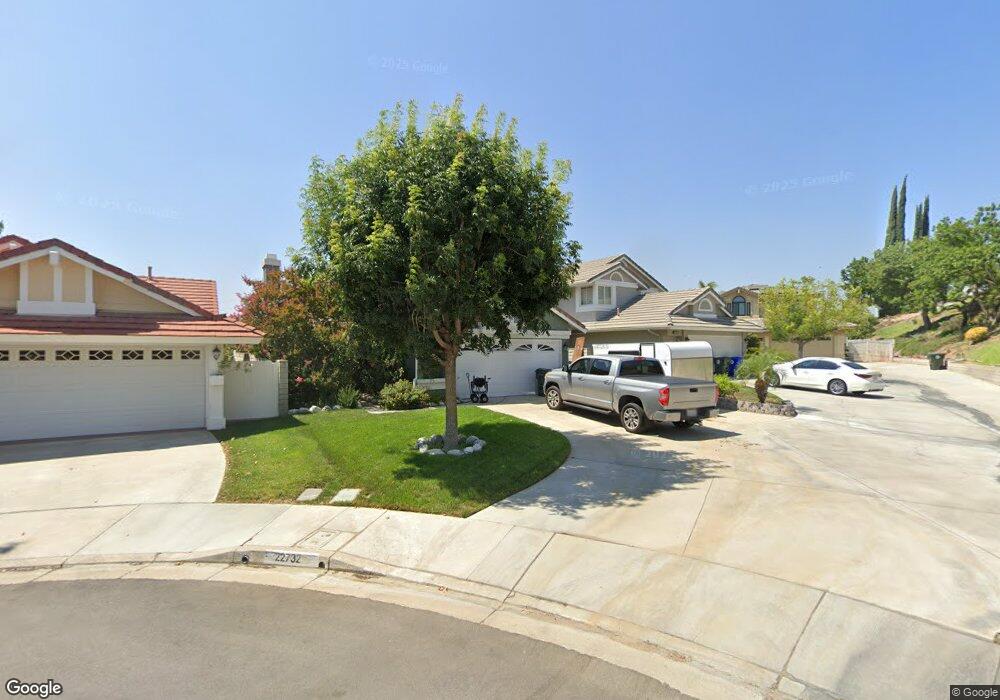
22732 Pear Ct Santa Clarita, CA 91390
Saugus NeighborhoodEstimated Value: $810,000 - $840,000
3
Beds
3
Baths
1,852
Sq Ft
$445/Sq Ft
Est. Value
About This Home
This home is located at 22732 Pear Ct, Santa Clarita, CA 91390 and is currently estimated at $824,944, approximately $445 per square foot. 22732 Pear Ct is a home located in Los Angeles County with nearby schools including Mountainview Elementary School, Arroyo Seco Junior High School, and Saugus High School.
Ownership History
Date
Name
Owned For
Owner Type
Purchase Details
Closed on
Mar 10, 2022
Sold by
Unknown
Bought by
Boliver Family Trust and Boliver
Current Estimated Value
Purchase Details
Closed on
Nov 14, 1998
Sold by
Jatico Neilson R and Jatico Julie J
Bought by
Boliver Rancy L and Boliver Barbara A
Home Financials for this Owner
Home Financials are based on the most recent Mortgage that was taken out on this home.
Original Mortgage
$210,400
Interest Rate
6.69%
Purchase Details
Closed on
Jan 27, 1998
Sold by
Federal National Mortgage Association
Bought by
Jatico Neilson R and Jatico Julie J
Home Financials for this Owner
Home Financials are based on the most recent Mortgage that was taken out on this home.
Original Mortgage
$183,300
Interest Rate
6.97%
Mortgage Type
Seller Take Back
Purchase Details
Closed on
Nov 20, 1997
Sold by
Buter Scott H and Federal National Mortgage Asso
Bought by
Federal National Mortgage Association
Create a Home Valuation Report for This Property
The Home Valuation Report is an in-depth analysis detailing your home's value as well as a comparison with similar homes in the area
Home Values in the Area
Average Home Value in this Area
Purchase History
| Date | Buyer | Sale Price | Title Company |
|---|---|---|---|
| Boliver Family Trust | -- | Wang Joshwa | |
| Boliver Rancy L | $219,000 | Investors Title Company | |
| Jatico Neilson R | -- | Investors Title Company | |
| Federal National Mortgage Association | $184,888 | First Southwestern Title Co |
Source: Public Records
Mortgage History
| Date | Status | Borrower | Loan Amount |
|---|---|---|---|
| Previous Owner | Boliver Rancy L | $210,400 | |
| Previous Owner | Jatico Neilson R | $183,300 |
Source: Public Records
Tax History Compared to Growth
Tax History
| Year | Tax Paid | Tax Assessment Tax Assessment Total Assessment is a certain percentage of the fair market value that is determined by local assessors to be the total taxable value of land and additions on the property. | Land | Improvement |
|---|---|---|---|---|
| 2025 | $6,363 | $385,477 | $137,945 | $247,532 |
| 2024 | $6,363 | $377,920 | $135,241 | $242,679 |
| 2023 | $6,137 | $370,511 | $132,590 | $237,921 |
| 2022 | $6,115 | $363,247 | $129,991 | $233,256 |
| 2021 | $5,972 | $356,126 | $127,443 | $228,683 |
| 2019 | $5,804 | $345,565 | $123,664 | $221,901 |
| 2018 | $5,640 | $338,790 | $121,240 | $217,550 |
| 2017 | $5,419 | $332,148 | $118,863 | $213,285 |
| 2016 | $5,234 | $325,636 | $116,533 | $209,103 |
| 2015 | $5,063 | $320,746 | $114,783 | $205,963 |
| 2014 | $4,998 | $314,464 | $112,535 | $201,929 |
Source: Public Records
Map
Nearby Homes
- 28321 Evergreen Ln
- 28345 Seco Canyon Rd Unit 97
- 28341 Seco Canyon Rd Unit 107
- 28415 Seco Canyon Rd Unit 125
- 28241 Tamarack Ln
- 22911 Banyan Place
- 28121 Seco Canyon Rd Unit 86
- 28435 Seco Canyon Rd Unit 154
- 22713 Copper Hill Dr Unit 42
- 28114 Seco Canyon Rd Unit 156
- 22943 Banyan Place Unit 306
- 22617 Copper Hill Dr Unit 121
- 22440 Skylake Place
- 28724 Magnolia Way
- 28015 Tupelo Ridge Dr
- 27929 Dexter Dr
- 28330 Medlar Dr
- 28301 Lobelia Ln
- 28066 Liana Ln
- 27573 Santa Clarita Rd
- 22734 Pear Ct
- 22730 Pear Ct
- 22728 Pear Ct
- 22736 Pear Ct
- 22722 Pear Ct
- 28335 Evergreen Ln
- 28331 Evergreen Ln
- 28339 Evergreen Ln
- 28327 Evergreen Ln
- 22711 Pear Ct
- 28343 Evergreen Ln
- 22811 Banyan Place Unit 372
- 22811 Banyan Place Unit 371
- 22811 Banyan Place Unit 370
- 22811 Banyan Place Unit 369
- 28347 Evergreen Ln
- 28351 Evergreen Ln
- 22718 Pear Ct
- 22703 Pear Ct
- 22714 Pear Ct