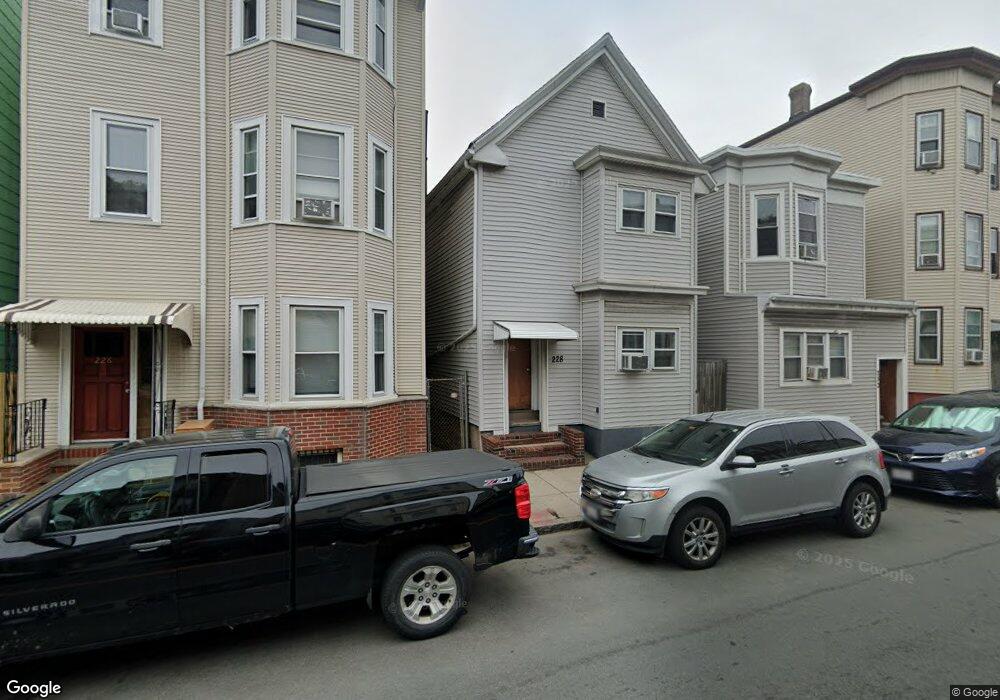
228 Bennington St Boston, MA 02128
Central Maverick Square-Paris Street NeighborhoodEstimated Value: $675,000 - $926,000
5
Beds
3
Baths
1,720
Sq Ft
$479/Sq Ft
Est. Value
About This Home
This home is located at 228 Bennington St, Boston, MA 02128 and is currently estimated at $823,667, approximately $478 per square foot. 228 Bennington St is a home located in Suffolk County with nearby schools including Excel Academy East Boston and East Boston Central Catholic School.
Ownership History
Date
Name
Owned For
Owner Type
Purchase Details
Closed on
Sep 5, 2019
Sold by
Nolan Mark
Bought by
Nolan Joanne and Nolan Mark
Current Estimated Value
Home Financials for this Owner
Home Financials are based on the most recent Mortgage that was taken out on this home.
Original Mortgage
$350,000
Outstanding Balance
$269,936
Interest Rate
3.6%
Mortgage Type
New Conventional
Estimated Equity
$553,731
Create a Home Valuation Report for This Property
The Home Valuation Report is an in-depth analysis detailing your home's value as well as a comparison with similar homes in the area
Home Values in the Area
Average Home Value in this Area
Purchase History
| Date | Buyer | Sale Price | Title Company |
|---|---|---|---|
| Nolan Joanne | -- | -- |
Source: Public Records
Mortgage History
| Date | Status | Borrower | Loan Amount |
|---|---|---|---|
| Open | Nolan Joanne | $350,000 |
Source: Public Records
Tax History Compared to Growth
Tax History
| Year | Tax Paid | Tax Assessment Tax Assessment Total Assessment is a certain percentage of the fair market value that is determined by local assessors to be the total taxable value of land and additions on the property. | Land | Improvement |
|---|---|---|---|---|
| 2025 | $8,348 | $720,900 | $208,500 | $512,400 |
| 2024 | $6,906 | $633,600 | $220,200 | $413,400 |
| 2023 | $6,737 | $627,300 | $218,000 | $409,300 |
| 2022 | $6,261 | $575,500 | $200,000 | $375,500 |
| 2021 | $6,141 | $575,500 | $200,000 | $375,500 |
| 2020 | $5,733 | $542,900 | $222,400 | $320,500 |
| 2019 | $5,109 | $484,700 | $134,000 | $350,700 |
| 2018 | $4,535 | $432,700 | $134,000 | $298,700 |
| 2017 | $3,983 | $376,100 | $134,000 | $242,100 |
| 2016 | $3,598 | $327,100 | $134,000 | $193,100 |
| 2015 | $3,587 | $296,200 | $101,400 | $194,800 |
| 2014 | $3,241 | $257,600 | $101,400 | $156,200 |
Source: Public Records
Map
Nearby Homes
- 301 Saratoga St Unit 2
- 160 Putnam St
- 326 Chelsea St Unit 3
- 125 Putnam St
- 223 Saratoga St Unit 203
- 219 Saratoga St Unit 2
- 219 Saratoga St Unit PH-S
- 89 Prescott St Unit C
- 107 Putnam St Unit 3
- 403-405 Saratoga St
- 157 Princeton St Unit 1
- 98 Prescott St Unit 2
- 98 Prescott St Unit 1
- 421 Saratoga St Unit 4A
- 421 Saratoga St Unit 1
- 421 Saratoga St Unit 7
- 421 Saratoga St Unit 3
- 421 Saratoga St Unit 5A
- 421 Saratoga St Unit 8
- 167 Lexington St Unit 1
- 230 Bennington St
- 226 Bennington St
- 232 Bennington St
- 232 Bennington St Unit 3
- 216 Bennington St
- 234 Bennington St
- 214 Bennington St
- 214 Bennington St Unit 3
- 214 Bennington St Unit 2
- 325R Saratoga St
- 212 Bennington St
- 212 Bennington St Unit 2
- 212 Bennington St Unit 1
- 236 Bennington St
- 319 Saratoga St
- 317 Saratoga St
- 210 Bennington St
- 210 Bennington St Unit 2
- 225 Bennington St
- 225 Bennington St Unit 2