Estimated Value: $420,000 - $466,000
4
Beds
3
Baths
3,005
Sq Ft
$145/Sq Ft
Est. Value
About This Home
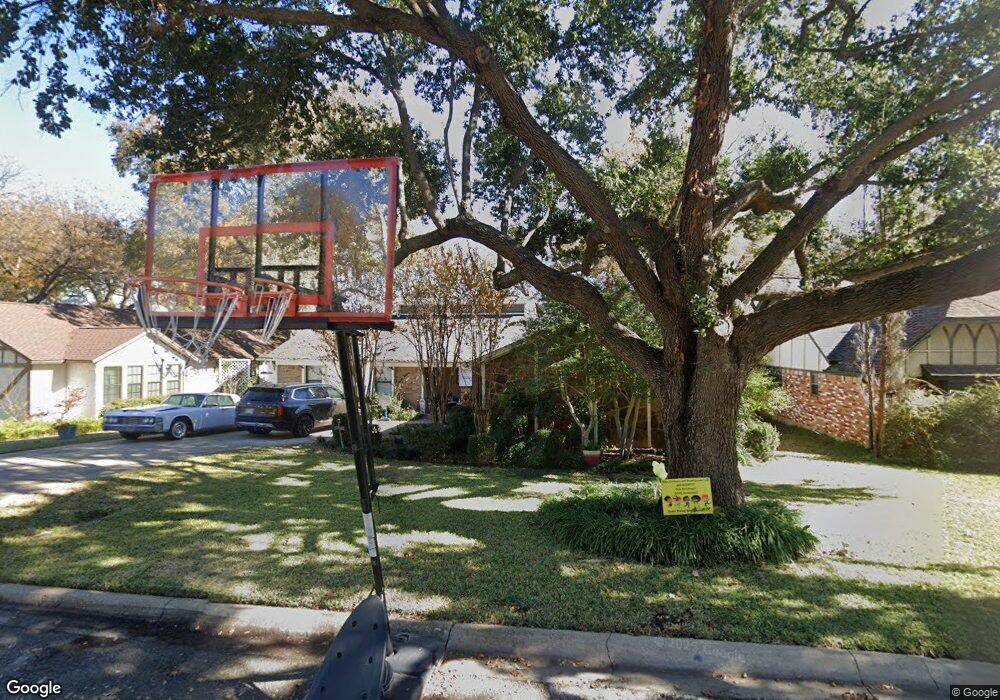
This home is located at 228 Bradford Dr, Hurst, TX 76053 and is currently estimated at $436,218, approximately $145 per square foot. 228 Bradford Dr is a home located in Tarrant County with nearby schools including Hurst Hills Elementary School, Hurst J High School, and L.D. Bell High School.
Ownership History
Date
Name
Owned For
Owner Type
Purchase Details
Closed on
Dec 15, 2016
Sold by
Terr Investment Properites Llc
Bought by
Thomas William Earl and Spotwood Keturah
Current Estimated Value
Home Financials for this Owner
Home Financials are based on the most recent Mortgage that was taken out on this home.
Original Mortgage
$274,500
Outstanding Balance
$221,791
Interest Rate
3.54%
Mortgage Type
VA
Estimated Equity
$214,427
Purchase Details
Closed on
Feb 23, 2016
Sold by
Heb Homes Llc
Bought by
Teer Investment Properties Llc
Purchase Details
Closed on
Feb 16, 2016
Sold by
Cohen Allison R and Wullaert Andreas
Bought by
Heb Homes Llc
Purchase Details
Closed on
Apr 18, 2000
Sold by
Oldridge Albert John and Oldridge Sheila Patricia
Bought by
Cohen Allison R
Home Financials for this Owner
Home Financials are based on the most recent Mortgage that was taken out on this home.
Original Mortgage
$104,000
Interest Rate
8.19%
Create a Home Valuation Report for This Property
The Home Valuation Report is an in-depth analysis detailing your home's value as well as a comparison with similar homes in the area
Home Values in the Area
Average Home Value in this Area
Purchase History
| Date | Buyer | Sale Price | Title Company |
|---|---|---|---|
| Thomas William Earl | -- | None Available | |
| Teer Investment Properties Llc | -- | None Available | |
| Heb Homes Llc | -- | None Available | |
| Cohen Allison R | -- | Safeco Land Title |
Source: Public Records
Mortgage History
| Date | Status | Borrower | Loan Amount |
|---|---|---|---|
| Open | Thomas William Earl | $274,500 | |
| Previous Owner | Cohen Allison R | $104,000 | |
| Closed | Cohen Allison R | $13,000 |
Source: Public Records
Tax History Compared to Growth
Tax History
| Year | Tax Paid | Tax Assessment Tax Assessment Total Assessment is a certain percentage of the fair market value that is determined by local assessors to be the total taxable value of land and additions on the property. | Land | Improvement |
|---|---|---|---|---|
| 2025 | $5,023 | $340,000 | $61,438 | $278,562 |
| 2024 | $5,023 | $340,000 | $61,438 | $278,562 |
| 2023 | $7,786 | $463,017 | $51,150 | $411,867 |
| 2022 | $8,134 | $413,188 | $51,183 | $362,005 |
| 2021 | $7,746 | $351,346 | $50,000 | $301,346 |
| 2020 | $7,025 | $291,981 | $50,000 | $241,981 |
| 2019 | $6,818 | $285,598 | $50,000 | $235,598 |
| 2018 | $5,278 | $253,246 | $25,000 | $228,246 |
| 2017 | $5,826 | $230,224 | $25,000 | $205,224 |
| 2016 | $5,377 | $212,488 | $25,000 | $187,488 |
| 2015 | $4,445 | $169,500 | $20,000 | $149,500 |
| 2014 | $4,445 | $169,500 | $20,000 | $149,500 |
Source: Public Records
Map
Nearby Homes
- 1200 Walker Dr
- 1112 Blakey Ct
- 405 Billy Creek Cir
- 228 Arcadia St
- 512 Billie Ruth Ln
- 8308 Fall Crest Dr
- 1304 W Redbud Dr
- 425 Moore Creek Rd
- 632 Melbourne Ct
- 808 Betty Ct
- 8105 Winter Falls Trail
- 1361 Kathryn Ct
- 8129 Trinity Vista Trail
- 3216 Fountain Pkwy
- 649 Timberline Dr
- 741 Ponderosa Dr
- 8736 Trinity Vista Trail
- 8528 Mystic Trail
- 8216 Snow Goose Way
- 637 Post Oak Dr
- 232 Bradford Dr
- 224 Bradford Dr
- 236 Bradford Dr
- 236 Bradford Dr
- 229 Bradford Dr
- 237 Bradford Dr
- 240 Bradford Dr
- 225 Bradford Dr
- 241 Bradford Dr
- 221 Bradford Dr
- 244 Bradford Dr
- 232 Melbourne Rd
- 228 Melbourne Rd
- 236 Melbourne Rd
- 217 Bradford Dr
- 224 Melbourne Rd
- 248 Bradford Dr
- 240 Melbourne Rd
- 1128 Harris Ave
- 220 Melbourne Rd