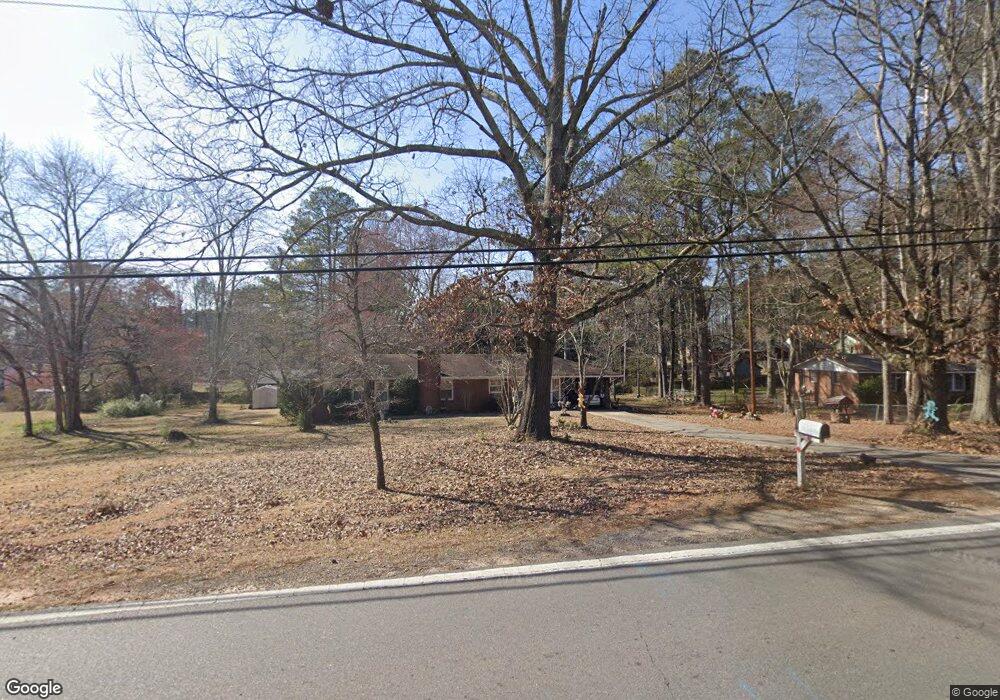
228 Harlan Lane Rd Villa Rica, GA 30180
Estimated Value: $211,000 - $248,000
3
Beds
2
Baths
1,800
Sq Ft
$129/Sq Ft
Est. Value
About This Home
This home is located at 228 Harlan Lane Rd, Villa Rica, GA 30180 and is currently estimated at $231,663, approximately $128 per square foot. 228 Harlan Lane Rd is a home located in Carroll County with nearby schools including Glanton-Hindsman Elementary School, Villa Rica Middle School, and Villa Rica High School.
Ownership History
Date
Name
Owned For
Owner Type
Purchase Details
Closed on
May 21, 2010
Sold by
Secretary Of Veterans Affa
Bought by
Holland
Current Estimated Value
Purchase Details
Closed on
Mar 2, 2010
Sold by
Battle Hardison Robinson
Bought by
Bac Home Loans Servicing Lp
Purchase Details
Closed on
Feb 26, 2008
Sold by
Black Floy
Bought by
Hardison Robinson Battle
Home Financials for this Owner
Home Financials are based on the most recent Mortgage that was taken out on this home.
Original Mortgage
$77,000
Interest Rate
5.63%
Mortgage Type
VA
Purchase Details
Closed on
Dec 3, 2006
Sold by
Not Provided
Bought by
Holland
Purchase Details
Closed on
Mar 15, 2004
Sold by
Black Floy
Bought by
Black Floy and Black Patsy
Purchase Details
Closed on
Nov 10, 1999
Sold by
Morris
Bought by
Black Floy
Purchase Details
Closed on
Aug 17, 1992
Bought by
Morris
Create a Home Valuation Report for This Property
The Home Valuation Report is an in-depth analysis detailing your home's value as well as a comparison with similar homes in the area
Home Values in the Area
Average Home Value in this Area
Purchase History
| Date | Buyer | Sale Price | Title Company |
|---|---|---|---|
| Holland | $41,000 | -- | |
| Bac Home Loans Servicing Lp | -- | -- | |
| Hardison Robinson Battle | $77,000 | -- | |
| Black Floy | -- | -- | |
| Holland | -- | -- | |
| Black Floy | -- | -- | |
| Black Floy | $18,900 | -- | |
| Morris | -- | -- |
Source: Public Records
Mortgage History
| Date | Status | Borrower | Loan Amount |
|---|---|---|---|
| Previous Owner | Black Floy | $77,000 |
Source: Public Records
Tax History Compared to Growth
Tax History
| Year | Tax Paid | Tax Assessment Tax Assessment Total Assessment is a certain percentage of the fair market value that is determined by local assessors to be the total taxable value of land and additions on the property. | Land | Improvement |
|---|---|---|---|---|
| 2024 | $1,329 | $58,732 | $7,133 | $51,599 |
| 2023 | $1,329 | $52,737 | $5,707 | $47,030 |
| 2022 | $1,041 | $41,525 | $3,805 | $37,720 |
| 2021 | $912 | $35,557 | $3,044 | $32,513 |
| 2020 | $820 | $31,963 | $2,767 | $29,196 |
| 2019 | $759 | $29,344 | $2,767 | $26,577 |
| 2018 | $685 | $26,098 | $2,586 | $23,512 |
| 2017 | $687 | $26,098 | $2,586 | $23,512 |
| 2016 | $688 | $26,098 | $2,586 | $23,512 |
| 2015 | $649 | $23,201 | $3,593 | $19,608 |
| 2014 | $652 | $23,202 | $3,593 | $19,608 |
Source: Public Records
Map
Nearby Homes
- 240 Harlan Lane Rd
- 206 Harlan Lane Rd
- 145 Sunny Ln
- 155 Sunny Ln
- 135 Sunny Ln
- 248 Harlan Lane Rd
- 231 Harlan Lane Rd
- 217 Harlan Lane Rd
- 175 Sunny Ln
- 125 Sunny Ln
- 198 Harlan Lane Rd
- 115 Sunny Ln
- 195 Harlan Lane Rd
- 181 Sunny Ln
- 255 Harlan Lane Rd
- 188 Harlan Lane Rd
- 25 Harlan Lane Dr
- 160 Sunny Ln
- 0 Sunny Ln Unit 8909701
- 0 Sunny Ln Unit 7442552