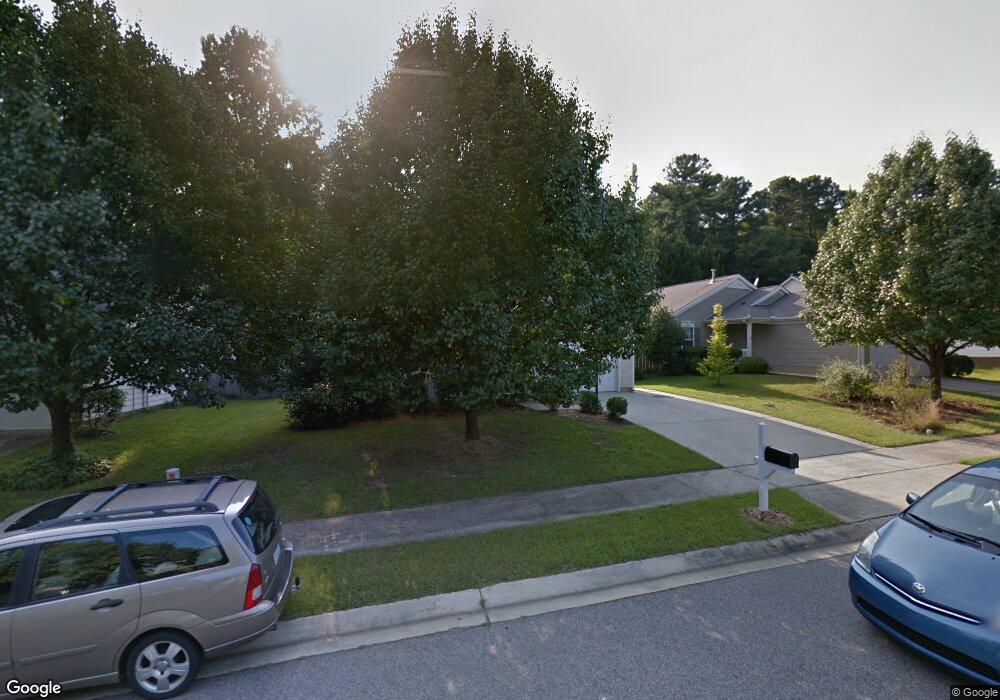
228 Tullich Way Holly Springs, NC 27540
Estimated Value: $373,417 - $394,000
3
Beds
3
Baths
1,588
Sq Ft
$239/Sq Ft
Est. Value
About This Home
This home is located at 228 Tullich Way, Holly Springs, NC 27540 and is currently estimated at $379,854, approximately $239 per square foot. 228 Tullich Way is a home located in Wake County with nearby schools including Oakview Elementary School, Apex Friendship Middle School, and Holly Springs High School.
Ownership History
Date
Name
Owned For
Owner Type
Purchase Details
Closed on
Dec 31, 2012
Sold by
Us Bank Na
Bought by
American Homes 4 Rent Lp
Current Estimated Value
Purchase Details
Closed on
Dec 3, 2012
Sold by
Mclean Corsandra D
Bought by
Us Bank Na
Purchase Details
Closed on
Mar 31, 2006
Sold by
Jackovich Mandy J Formanek and Jackovich Todd M
Bought by
Mclean Corsandra D
Home Financials for this Owner
Home Financials are based on the most recent Mortgage that was taken out on this home.
Original Mortgage
$124,000
Interest Rate
6.31%
Mortgage Type
Purchase Money Mortgage
Purchase Details
Closed on
Aug 25, 2000
Sold by
Beazer Homes Corp
Bought by
Jackovich Todd M and Jackovich Mandy J Formanek
Home Financials for this Owner
Home Financials are based on the most recent Mortgage that was taken out on this home.
Original Mortgage
$129,779
Interest Rate
8.07%
Mortgage Type
FHA
Create a Home Valuation Report for This Property
The Home Valuation Report is an in-depth analysis detailing your home's value as well as a comparison with similar homes in the area
Home Values in the Area
Average Home Value in this Area
Purchase History
| Date | Buyer | Sale Price | Title Company |
|---|---|---|---|
| American Homes 4 Rent Lp | $138,000 | None Available | |
| Us Bank Na | $138,659 | None Available | |
| Mclean Corsandra D | $155,000 | None Available | |
| Jackovich Todd M | $131,000 | -- |
Source: Public Records
Mortgage History
| Date | Status | Borrower | Loan Amount |
|---|---|---|---|
| Previous Owner | Mclean Corsandra D | $124,000 | |
| Previous Owner | Jackovich Todd M | $129,779 |
Source: Public Records
Tax History Compared to Growth
Tax History
| Year | Tax Paid | Tax Assessment Tax Assessment Total Assessment is a certain percentage of the fair market value that is determined by local assessors to be the total taxable value of land and additions on the property. | Land | Improvement |
|---|---|---|---|---|
| 2025 | $3,117 | $359,841 | $115,000 | $244,841 |
| 2024 | $3,104 | $359,841 | $115,000 | $244,841 |
| 2023 | $2,408 | $221,372 | $50,000 | $171,372 |
| 2022 | $2,325 | $221,372 | $50,000 | $171,372 |
| 2021 | $2,282 | $221,372 | $50,000 | $171,372 |
| 2020 | $2,282 | $221,372 | $50,000 | $171,372 |
| 2019 | $2,185 | $179,959 | $50,000 | $129,959 |
| 2018 | $1,976 | $179,959 | $50,000 | $129,959 |
| 2017 | $1,905 | $179,959 | $50,000 | $129,959 |
| 2016 | $1,879 | $179,959 | $50,000 | $129,959 |
| 2015 | $1,704 | $160,474 | $35,000 | $125,474 |
| 2014 | $1,646 | $160,474 | $35,000 | $125,474 |
Source: Public Records
Map
Nearby Homes
- 225 Douglas St
- 108 Crabwall Ct
- 124 Cliffdale Rd
- 737 W Holly Springs Rd
- 743 W Holly Springs Rd
- 749 W Holly Springs Rd
- 755 W Holly Springs Rd
- 112 Burt St
- 761 W Holly Springs Rd
- 321 Cross Hill Ln
- 105 Cross Hill Ln
- 321 Blalock St
- 717 Starkland Way
- 936 W Holly Springs Rd
- 920 W Holly Springs Rd
- 713 Littleleaf Ct
- 105 Townsgate Ct
- 405 W Ballentine St
- 224 Hartshorn Ct
- 104 Chilmark Ridge Dr
- 224 Tullich Way
- 232 Tullich Way
- 220 Tullich Way
- 225 Tullich Way
- 213 Gremar Dr Unit 53 Avalon II B
- 216 Tullich Way
- 221 Tullich Way
- 211 Gremar Dr
- 211 Gremar Dr Unit 52 Carson II F
- 209 Gremar Dr
- 209 Gremar Dr Unit 51 Brady II A
- 229 Tullich Way
- 207 Gremar Dr
- 207 Gremar Dr Unit 50 Brady II B
- 217 Tullich Way
- 205 Gremar Dr Unit 49 Carson II C
- 213 Tullich Way
- 203 Gremar Dr Unit 48 Avalon II A
- 212 Tullich Way
- 621 West Holly Springs Rd