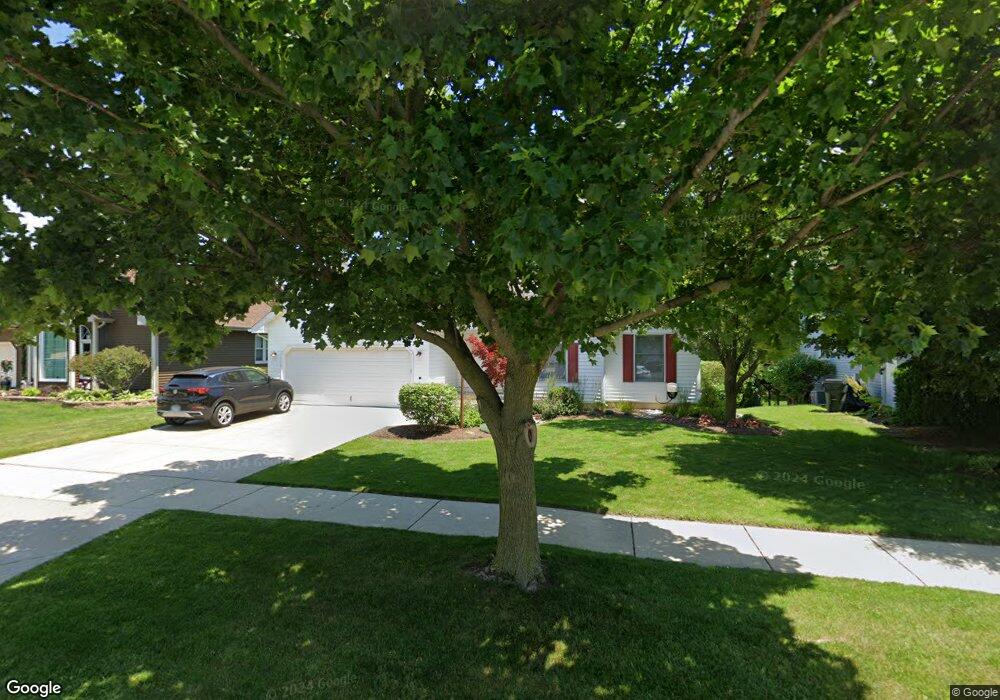
229 Potomac Ln Winthrop Harbor, IL 60096
Estimated Value: $315,000 - $361,000
3
Beds
2
Baths
1,228
Sq Ft
$273/Sq Ft
Est. Value
About This Home
This home is located at 229 Potomac Ln, Winthrop Harbor, IL 60096 and is currently estimated at $334,920, approximately $272 per square foot. 229 Potomac Ln is a home located in Lake County with nearby schools including Westfield School, North Prairie Junior High School, and Zion-Benton Township High School.
Ownership History
Date
Name
Owned For
Owner Type
Purchase Details
Closed on
Jun 14, 2004
Sold by
White Daniel and Palmer Lisa
Bought by
Zupec Scott and Zupec Jamie
Current Estimated Value
Home Financials for this Owner
Home Financials are based on the most recent Mortgage that was taken out on this home.
Original Mortgage
$226,000
Outstanding Balance
$113,209
Interest Rate
6.37%
Mortgage Type
Unknown
Estimated Equity
$221,711
Purchase Details
Closed on
Oct 15, 2002
Sold by
Japuntich John S and Japuntich Barbara E
Bought by
White Daniel and Palmeri Lisa
Home Financials for this Owner
Home Financials are based on the most recent Mortgage that was taken out on this home.
Original Mortgage
$140,000
Interest Rate
5%
Purchase Details
Closed on
Sep 11, 1995
Sold by
Japuntich John C and Japuntich Kenneth A
Bought by
Japuntich John S and Japuntich Barbara E
Purchase Details
Closed on
Feb 28, 1995
Sold by
Bank Of Waukegan
Bought by
Japuntich John C and Japuntich Kenneth A
Create a Home Valuation Report for This Property
The Home Valuation Report is an in-depth analysis detailing your home's value as well as a comparison with similar homes in the area
Home Values in the Area
Average Home Value in this Area
Purchase History
| Date | Buyer | Sale Price | Title Company |
|---|---|---|---|
| Zupec Scott | $256,000 | -- | |
| White Daniel | $213,000 | Attorneys Title Guaranty Fun | |
| Japuntich John S | $120,000 | -- | |
| Japuntich John C | $35,000 | -- |
Source: Public Records
Mortgage History
| Date | Status | Borrower | Loan Amount |
|---|---|---|---|
| Open | Zupec Scott | $226,000 | |
| Previous Owner | White Daniel | $140,000 |
Source: Public Records
Tax History Compared to Growth
Tax History
| Year | Tax Paid | Tax Assessment Tax Assessment Total Assessment is a certain percentage of the fair market value that is determined by local assessors to be the total taxable value of land and additions on the property. | Land | Improvement |
|---|---|---|---|---|
| 2024 | $6,475 | $78,457 | $6,575 | $71,882 |
| 2023 | $6,243 | $68,411 | $6,347 | $62,064 |
| 2022 | $6,243 | $63,043 | $6,211 | $56,832 |
| 2021 | $6,026 | $58,304 | $6,053 | $52,251 |
| 2020 | $5,836 | $55,639 | $5,776 | $49,863 |
| 2019 | $5,686 | $52,788 | $5,480 | $47,308 |
| 2018 | $5,872 | $54,156 | $6,622 | $47,534 |
| 2017 | $5,822 | $50,947 | $6,230 | $44,717 |
| 2016 | $5,661 | $48,502 | $5,931 | $42,571 |
| 2015 | $5,544 | $44,481 | $5,439 | $39,042 |
| 2014 | $6,031 | $49,508 | $11,484 | $38,024 |
| 2012 | $5,949 | $51,448 | $11,934 | $39,514 |
Source: Public Records
Map
Nearby Homes
- 429 Megan Place
- 242 Thompson Ave
- 0 Garnett Ave
- 432 Megan Place
- 436 Megan Place
- 11279 W Russell Rd
- 12122 28th Ave
- 12111 28th Ave
- 43100 N Lewis Ave
- Lt0 39th Ave
- 42908 N Lewis Ave
- 1810 5th St
- Lt0 128th St
- 210 Oak Ln
- 830 Russell Ave
- 630 Whitney Ave
- 3109 11th St
- 737 Franklin Ave
- 3106 13th St
- 1228 Pennsylvania Ave
- 233 Potomac Ln
- 225 Potomac Ln
- 221 Potomac Ln
- 237 Potomac Ln
- 230 Potomac Ln
- 226 Potomac Ln
- 217 Potomac Ln
- 241 Potomac Ln
- 222 Potomac Ln
- 240 Potomac Ln
- 214 Potomac Ln
- 213 Potomac Ln
- 245 Potomac Ln
- 256 Potomac Ln
- 208 Potomac Ln
- 253 Potomac Ln
- 249 Potomac Ln
- 257 Potomac Ln
- 209 Potomac Ln
- 235 Old Darby Ln