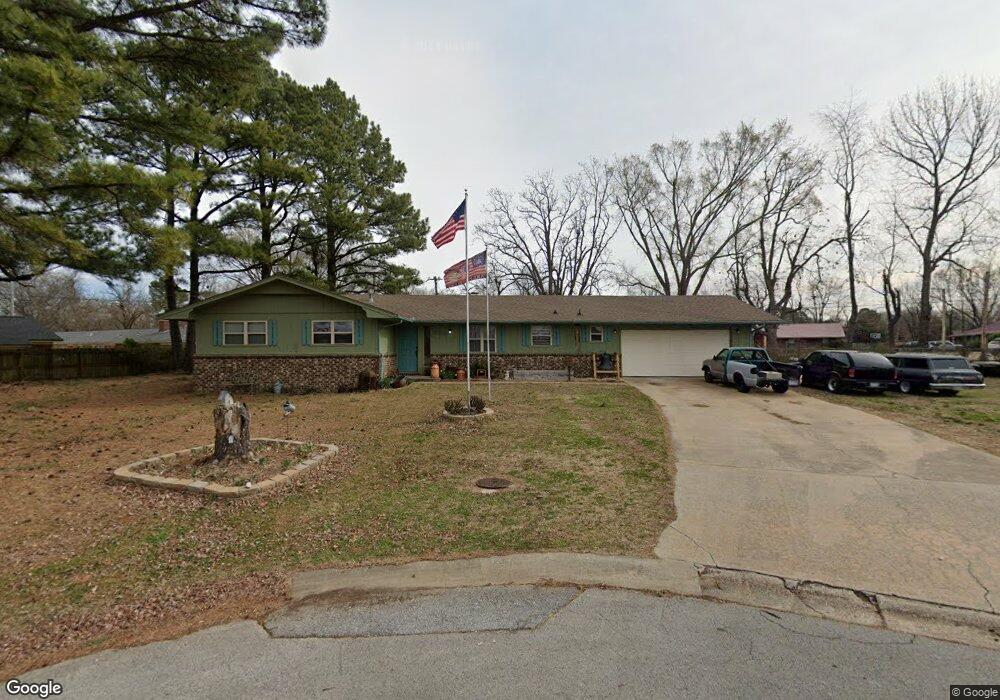
229 Rodric Dr Siloam Springs, AR 72761
Estimated Value: $226,000 - $255,000
3
Beds
2
Baths
1,578
Sq Ft
$154/Sq Ft
Est. Value
About This Home
This home is located at 229 Rodric Dr, Siloam Springs, AR 72761 and is currently estimated at $243,742, approximately $154 per square foot. 229 Rodric Dr is a home located in Benton County with nearby schools including Northside Elementary School, Southside Elementary School, and Delbert Pete & Pat Allen Elementary School.
Ownership History
Date
Name
Owned For
Owner Type
Purchase Details
Closed on
Jul 12, 2013
Sold by
Smith Larry L and The Larry L Smith Revocable Tr
Bought by
Norton Robert and Norton Lisa
Current Estimated Value
Purchase Details
Closed on
Jul 17, 2003
Bought by
Smith Rev Tr
Purchase Details
Closed on
Mar 27, 2002
Bought by
Smith
Purchase Details
Closed on
Nov 20, 1978
Bought by
Kapica
Create a Home Valuation Report for This Property
The Home Valuation Report is an in-depth analysis detailing your home's value as well as a comparison with similar homes in the area
Home Values in the Area
Average Home Value in this Area
Purchase History
| Date | Buyer | Sale Price | Title Company |
|---|---|---|---|
| Norton Robert | $100,000 | Rtc | |
| Smith Rev Tr | -- | -- | |
| Smith | $86,700 | -- | |
| Kapica | $5,000 | -- |
Source: Public Records
Tax History Compared to Growth
Tax History
| Year | Tax Paid | Tax Assessment Tax Assessment Total Assessment is a certain percentage of the fair market value that is determined by local assessors to be the total taxable value of land and additions on the property. | Land | Improvement |
|---|---|---|---|---|
| 2025 | $1,491 | $42,216 | $7,400 | $34,816 |
| 2024 | $1,460 | $42,216 | $7,400 | $34,816 |
| 2023 | $1,390 | $30,030 | $5,600 | $24,430 |
| 2022 | $954 | $30,030 | $5,600 | $24,430 |
| 2021 | $890 | $30,030 | $5,600 | $24,430 |
| 2020 | $834 | $20,990 | $5,600 | $15,390 |
| 2019 | $834 | $20,990 | $5,600 | $15,390 |
| 2018 | $859 | $20,990 | $5,600 | $15,390 |
| 2017 | $778 | $20,990 | $5,600 | $15,390 |
| 2016 | $778 | $20,990 | $5,600 | $15,390 |
| 2015 | $1,063 | $18,460 | $2,800 | $15,660 |
| 2014 | $713 | $18,460 | $2,800 | $15,660 |
Source: Public Records
Map
Nearby Homes
- 2326 W Alpine Cir
- 1810 & 1820 Twin Springs St
- 2209-2211 W Central St
- 2209 W Granite St
- 2206 W University St
- 130 Dogwood Place
- 2212 W Tulsa St
- 2117 Highway 412 W
- 537 S Dogwood St
- 1702 Highway 412 W
- 1005 W Jefferson St
- TBD S Hwy 59
- 1021 W Granite St
- Tract 2 Ok Hwy 59 & Hwy 412
- 1118 W Garland St
- 905 W Elgin St
- 920 W Granite St
- 825 W Granite St
- 1050 W Garland St Unit A & B
- 800 W Tahlequah St
- 229 Rodric Cir
- 229 Rodrick Dr
- 303 Rodric Cir
- 223 Rodrick Dr
- 223 Rodric Cir
- 303 Rodrick Dr
- 2014 W Central St
- 302 Rodric Cir
- 302 Rodrick Dr
- 313 Rodrick Dr
- 215 Rodric Dr
- 215 Rodrick Dr
- 312 Rodrick Dr
- 319 Rodric Cir
- 319 Rodrick Dr
- 318 Rodrick Dr
- 301 Rodrick Dr
- 301 Rodric Dr
- 315 Rodrick Dr
- 207 Rodrick Dr