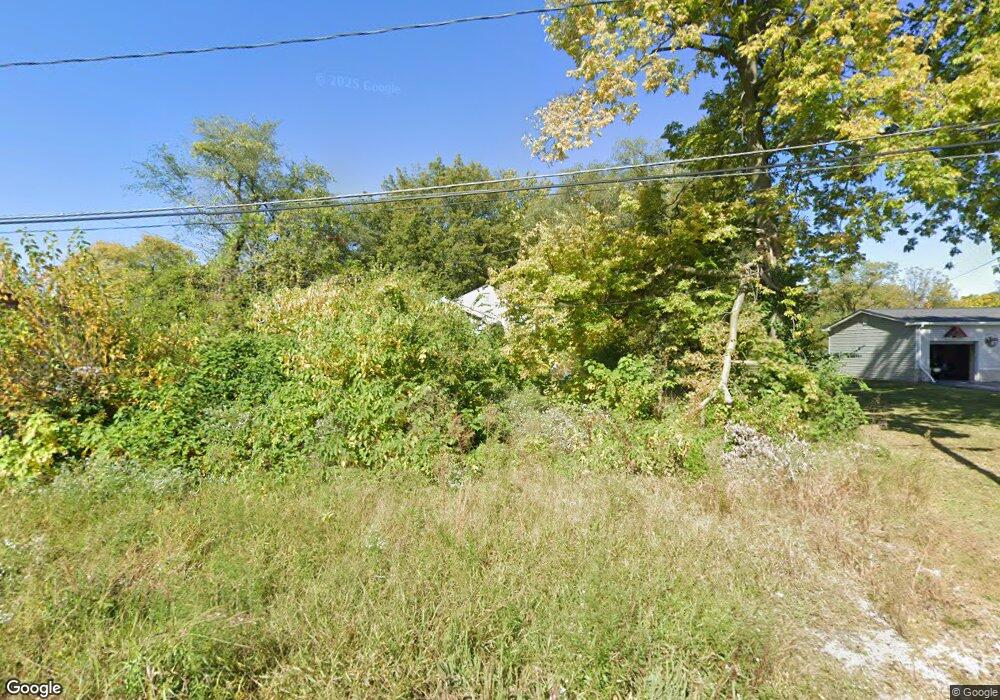
229 Rose Ln East Saint Louis, IL 62207
Estimated Value: $35,000 - $58,000
2
Beds
1
Bath
952
Sq Ft
$54/Sq Ft
Est. Value
About This Home
This home is located at 229 Rose Ln, East Saint Louis, IL 62207 and is currently estimated at $51,182, approximately $53 per square foot. 229 Rose Ln is a home located in St. Clair County.
Ownership History
Date
Name
Owned For
Owner Type
Purchase Details
Closed on
Sep 26, 2022
Sold by
St Clair County Clerk
Bought by
St Clair County
Current Estimated Value
Purchase Details
Closed on
Jan 11, 2018
Sold by
Saint Clair County
Bought by
Quarles Hazell
Purchase Details
Closed on
Jul 18, 2017
Sold by
Harris Terrell
Bought by
County Of Saint Clair and Trust #07-05 0-106-039
Purchase Details
Closed on
Oct 9, 2013
Sold by
Federal National Mortgage Association
Bought by
Harris Terrell
Purchase Details
Closed on
Jul 26, 2013
Sold by
Reverse Mortgage Solutions Inc
Bought by
Federal National Mortgage Association
Purchase Details
Closed on
Jan 8, 2013
Sold by
Lewis Betty
Bought by
Reverse Mortgage Solutions Inc
Purchase Details
Closed on
Nov 19, 2002
Sold by
St Clair County
Bought by
Lewis Betty
Purchase Details
Closed on
Jun 27, 2002
Sold by
Delaney Bob
Bought by
St Clair County
Create a Home Valuation Report for This Property
The Home Valuation Report is an in-depth analysis detailing your home's value as well as a comparison with similar homes in the area
Home Values in the Area
Average Home Value in this Area
Purchase History
| Date | Buyer | Sale Price | Title Company |
|---|---|---|---|
| St Clair County | -- | None Available | |
| Quarles Hazell | -- | Attorney | |
| County Of Saint Clair | -- | Attorney | |
| Harris Terrell | $2,500 | None Available | |
| Federal National Mortgage Association | -- | None Available | |
| Reverse Mortgage Solutions Inc | -- | None Available | |
| Lewis Betty | -- | -- | |
| St Clair County | -- | -- |
Source: Public Records
Tax History Compared to Growth
Tax History
| Year | Tax Paid | Tax Assessment Tax Assessment Total Assessment is a certain percentage of the fair market value that is determined by local assessors to be the total taxable value of land and additions on the property. | Land | Improvement |
|---|---|---|---|---|
| 2024 | -- | $132 | $66 | $66 |
| 2023 | -- | $120 | $60 | $60 |
| 2022 | $0 | $106 | $53 | $53 |
| 2021 | $1,118 | $4,958 | $604 | $4,354 |
| 2020 | $1,533 | $6,830 | $634 | $6,196 |
| 2019 | $1,565 | $6,830 | $634 | $6,196 |
| 2018 | $1,559 | $6,930 | $643 | $6,287 |
| 2017 | $0 | $100 | $50 | $50 |
| 2016 | $1,398 | $5,805 | $625 | $5,180 |
| 2014 | $1,124 | $5,742 | $618 | $5,124 |
| 2013 | $332 | $5,386 | $580 | $4,806 |
Source: Public Records
Map
Nearby Homes