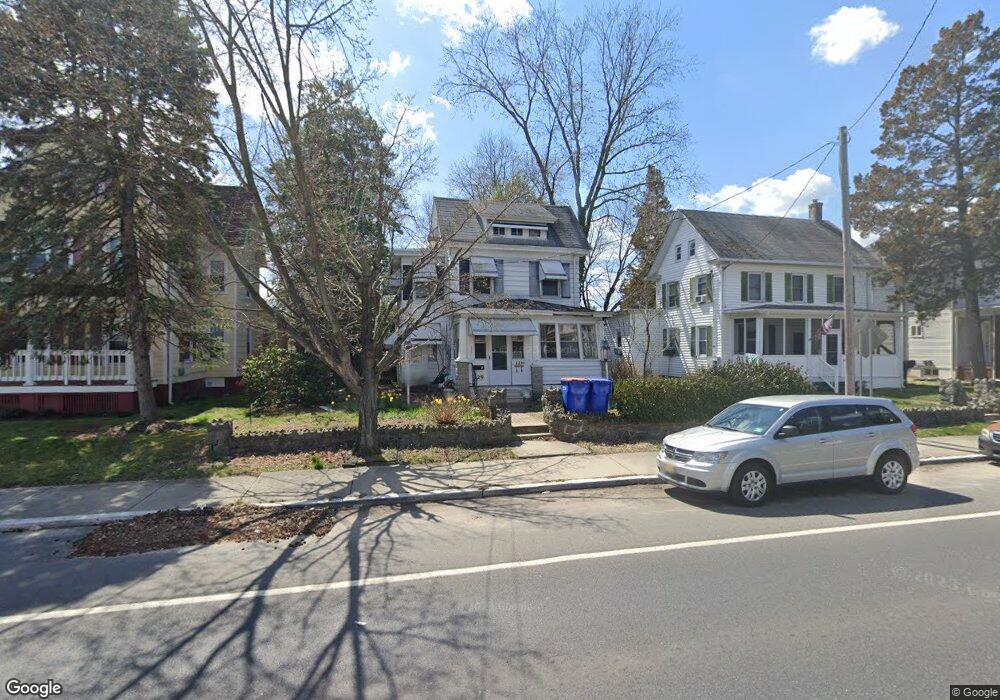
229 W Main St Millville, NJ 08332
Estimated Value: $193,000 - $309,000
--
Bed
--
Bath
1,789
Sq Ft
$152/Sq Ft
Est. Value
About This Home
This home is located at 229 W Main St, Millville, NJ 08332 and is currently estimated at $272,286, approximately $152 per square foot. 229 W Main St is a home located in Cumberland County with nearby schools including Silver Run Elementary School, Lakeside Middle School, and Memorial High School.
Ownership History
Date
Name
Owned For
Owner Type
Purchase Details
Closed on
Jul 29, 2021
Sold by
Mad Money Rentals Llc
Bought by
Huntington Associates Llc
Current Estimated Value
Purchase Details
Closed on
Apr 10, 2008
Sold by
Jdf Property Management Llc
Bought by
Mad Money Rentals Llc
Purchase Details
Closed on
May 17, 2006
Sold by
R & R Rentals Llc
Bought by
Jdf Property Management Llc
Purchase Details
Closed on
May 15, 2006
Sold by
Smithson Richard D
Bought by
R & R Rentals Llc
Purchase Details
Closed on
Dec 30, 2005
Sold by
Millville Army Air Field Museu
Bought by
Smithson Richard D
Create a Home Valuation Report for This Property
The Home Valuation Report is an in-depth analysis detailing your home's value as well as a comparison with similar homes in the area
Home Values in the Area
Average Home Value in this Area
Purchase History
| Date | Buyer | Sale Price | Title Company |
|---|---|---|---|
| Huntington Associates Llc | $245,000 | Surety Title | |
| Mad Money Rentals Llc | -- | -- | |
| Jdf Property Management Llc | $85,000 | -- | |
| R & R Rentals Llc | $50,000 | -- | |
| Smithson Richard D | $75,000 | -- | |
| Millville Army Air Field Museu | -- | -- |
Source: Public Records
Tax History Compared to Growth
Tax History
| Year | Tax Paid | Tax Assessment Tax Assessment Total Assessment is a certain percentage of the fair market value that is determined by local assessors to be the total taxable value of land and additions on the property. | Land | Improvement |
|---|---|---|---|---|
| 2025 | $4,208 | $107,200 | $15,000 | $92,200 |
| 2024 | $4,208 | $107,200 | $15,000 | $92,200 |
| 2023 | $4,172 | $107,200 | $15,000 | $92,200 |
| 2022 | $4,064 | $107,200 | $15,000 | $92,200 |
| 2021 | $3,932 | $107,200 | $15,000 | $92,200 |
| 2020 | $3,867 | $107,200 | $15,000 | $92,200 |
| 2019 | $3,688 | $107,200 | $15,000 | $92,200 |
| 2018 | $3,612 | $107,200 | $15,000 | $92,200 |
| 2017 | $3,578 | $107,200 | $15,000 | $92,200 |
| 2016 | $3,533 | $107,200 | $15,000 | $92,200 |
| 2015 | $3,454 | $107,200 | $15,000 | $92,200 |
| 2014 | $3,460 | $107,200 | $15,000 | $92,200 |
Source: Public Records
Map
Nearby Homes